Analyzing Results
Once you have successfully uploaded a project, you will be able to access results from your dataset in several different formats, both in spreadsheet format and visually with our suite of charts and graphing tools. This section provides details about each tab and type of chart and graph that the UI has to offer.
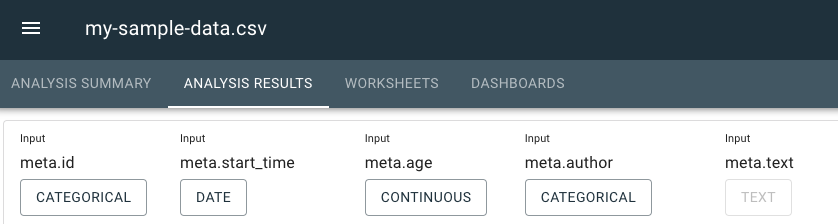
Analysis Results Tab
This is a table generated based on the analyzed dataset. It contains columns for:
-
Categorical Data: Qualitative data that can be divided into discrete groups. Categorical data is useful for filtering or grouping continuous measures, such as speaker names on a video call or the city of a survey respondent.
-
Continuous Data: Quantitative data that can be measured on an infinite scale and can take any value on that scale, such as the age of a survey respondent, company tenure of a survey respondent, or any Receptiviti measure.
-
Date: Time-based data that can be presented on a linear scale.
noteAt least one date-type column is required for line charts to work.
-
Text: Word- or sentence-based language data used for analysis.
All input data from the user-uploaded file is present in the table, as are all of the measures and their respective scores from the Receptiviti API. You can access documentation for our frameworks here.
The scores displayed here in the Analysis Results tab depend on the packages and/or frameworks that are part of your subscription.
Change Data Type
Clicking on a column’s data type button, Categorical, Continuous, Text, or Date, allows you to change the data type of a column to more accurately reflect its data. This will affect how the column's data can be used in charts. A column cannot be changed if it is currently used in a graph. A column that has already been analyzed cannot have its type changed, nor can the type of a column containing Receptiviti scores be changed.
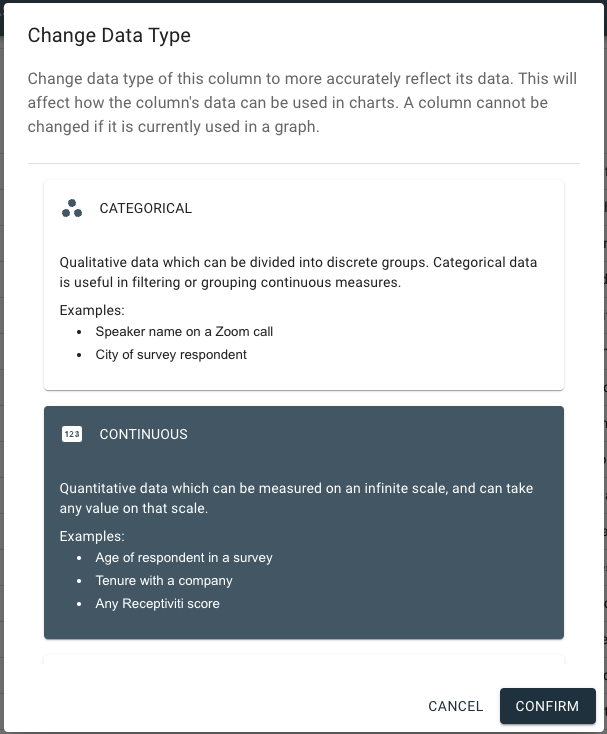
You can scroll down within the Change Data Type dialog to access the other data types.
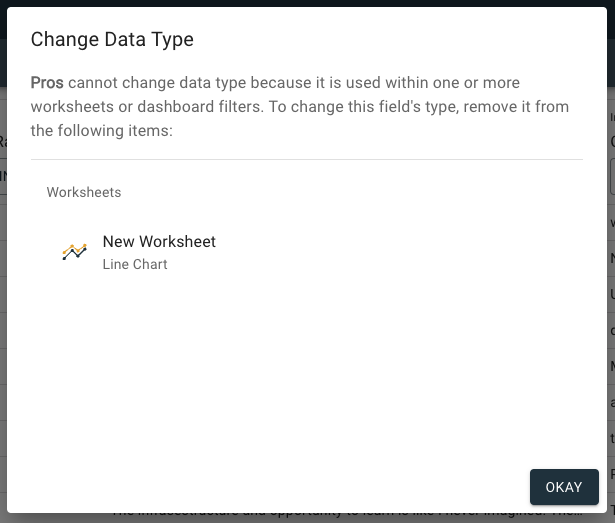
If you have already used data from a column in a worksheet or dashboard and you try to change the data type, you will not be able to change it, and will see a message similar to the one in the image below. To change it, you will have to remove the data from the column out of the worksheet(s) indicated in the message.
At the bottom left of the UI, you can click Filter Scores to toggle on or off the frameworks that display in the table.
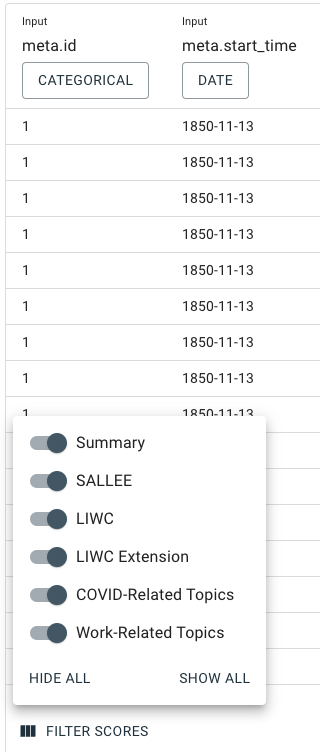
The scores displayed here in the Filter Scores feature depend on the packages and/or frameworks that are part of your subscription.
Charts and Graphs
Click any of the chart and graph types below to learn more about the UI's visualization tools.