DISC Quadrant Chart
This chart offers a comprehensive framework for understanding and mapping out various personality types and behavioural styles, allowing teams to better understand and facilitate group dynamics and personal development. It is often used in personality assessments and team-building exercises, visually representing different personality traits and behavioural styles by plotting nodes within a four-quadrant model.
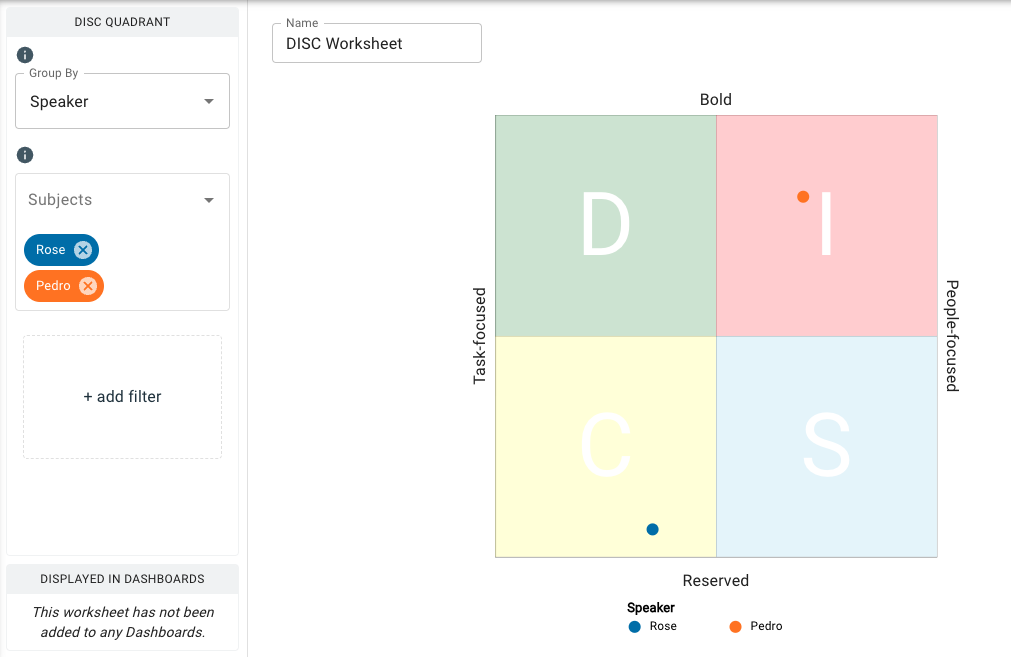
DISC is typically defined by four DISC styles, each representing a style of interacting with one’s environment:
- D is normally referred to as dominant; D-type people tend to be ambitious, active, bold leaders;
- I is alternately referred to as influence or inducement; I-type people lead through connections, creativity, and collaboration;
- S is called stable, submissive, steady, or supportive; S-type people tend to be faithful, modest, methodical people who value relationships; and
- C is labeled compliant, conscientious, or cautious; C-type people prefer to do their jobs accurately, unobtrusively, and impersonally.
A person’s score on the four DISC styles is derived from their scores on two dimensions of the DISC axis:
- Bold vs. Reserved; and
- People-focused vs. Task-focused
For in-depth information surrounding the history of DISC and Receptiviti's DISC framework, see the DISC page on our API documentation site.
Parameters
- The Group By drop-down menu allows you to set the column to use to group the chart’s data by selecting either the overall dataset or by a category such as
speaker_name,speaker_id, or any category your dataset is labeled with. Note that you can type in this field to search and select an existing category. - The Subjects drop-down menu allows you to select the data points to feature on the chart, such as the individual speaker or speakers.
- The Add Filter option allows you to further filter by categorical input data. For example, if you had many speakers in a meeting and wanted to view the data for a smaller subset or single individual, you could filter them here by clicking Add Filter and selecting your desired input value(s).
note
When using Add Filter you can only filter by categorical variable(s) that you haven’t already used for your Group By field. For example, if you have selected all the speakers in your dataset to display on the chart, you will not have anything else to filter by, so there will be no option in the menu. Further filtering beyond speakers is more applicable to datasets that contain more metadata columns to filter by.