Lollipop Chart
This chart plots normed measures from a single framework to generate an individual or group profile, defaulting to display aggregate scores for the overall dataset. It works well with categorical variables such as speaker, gender, office location, age, and tenure, among others. You can use the filter to narrow down to a single category.
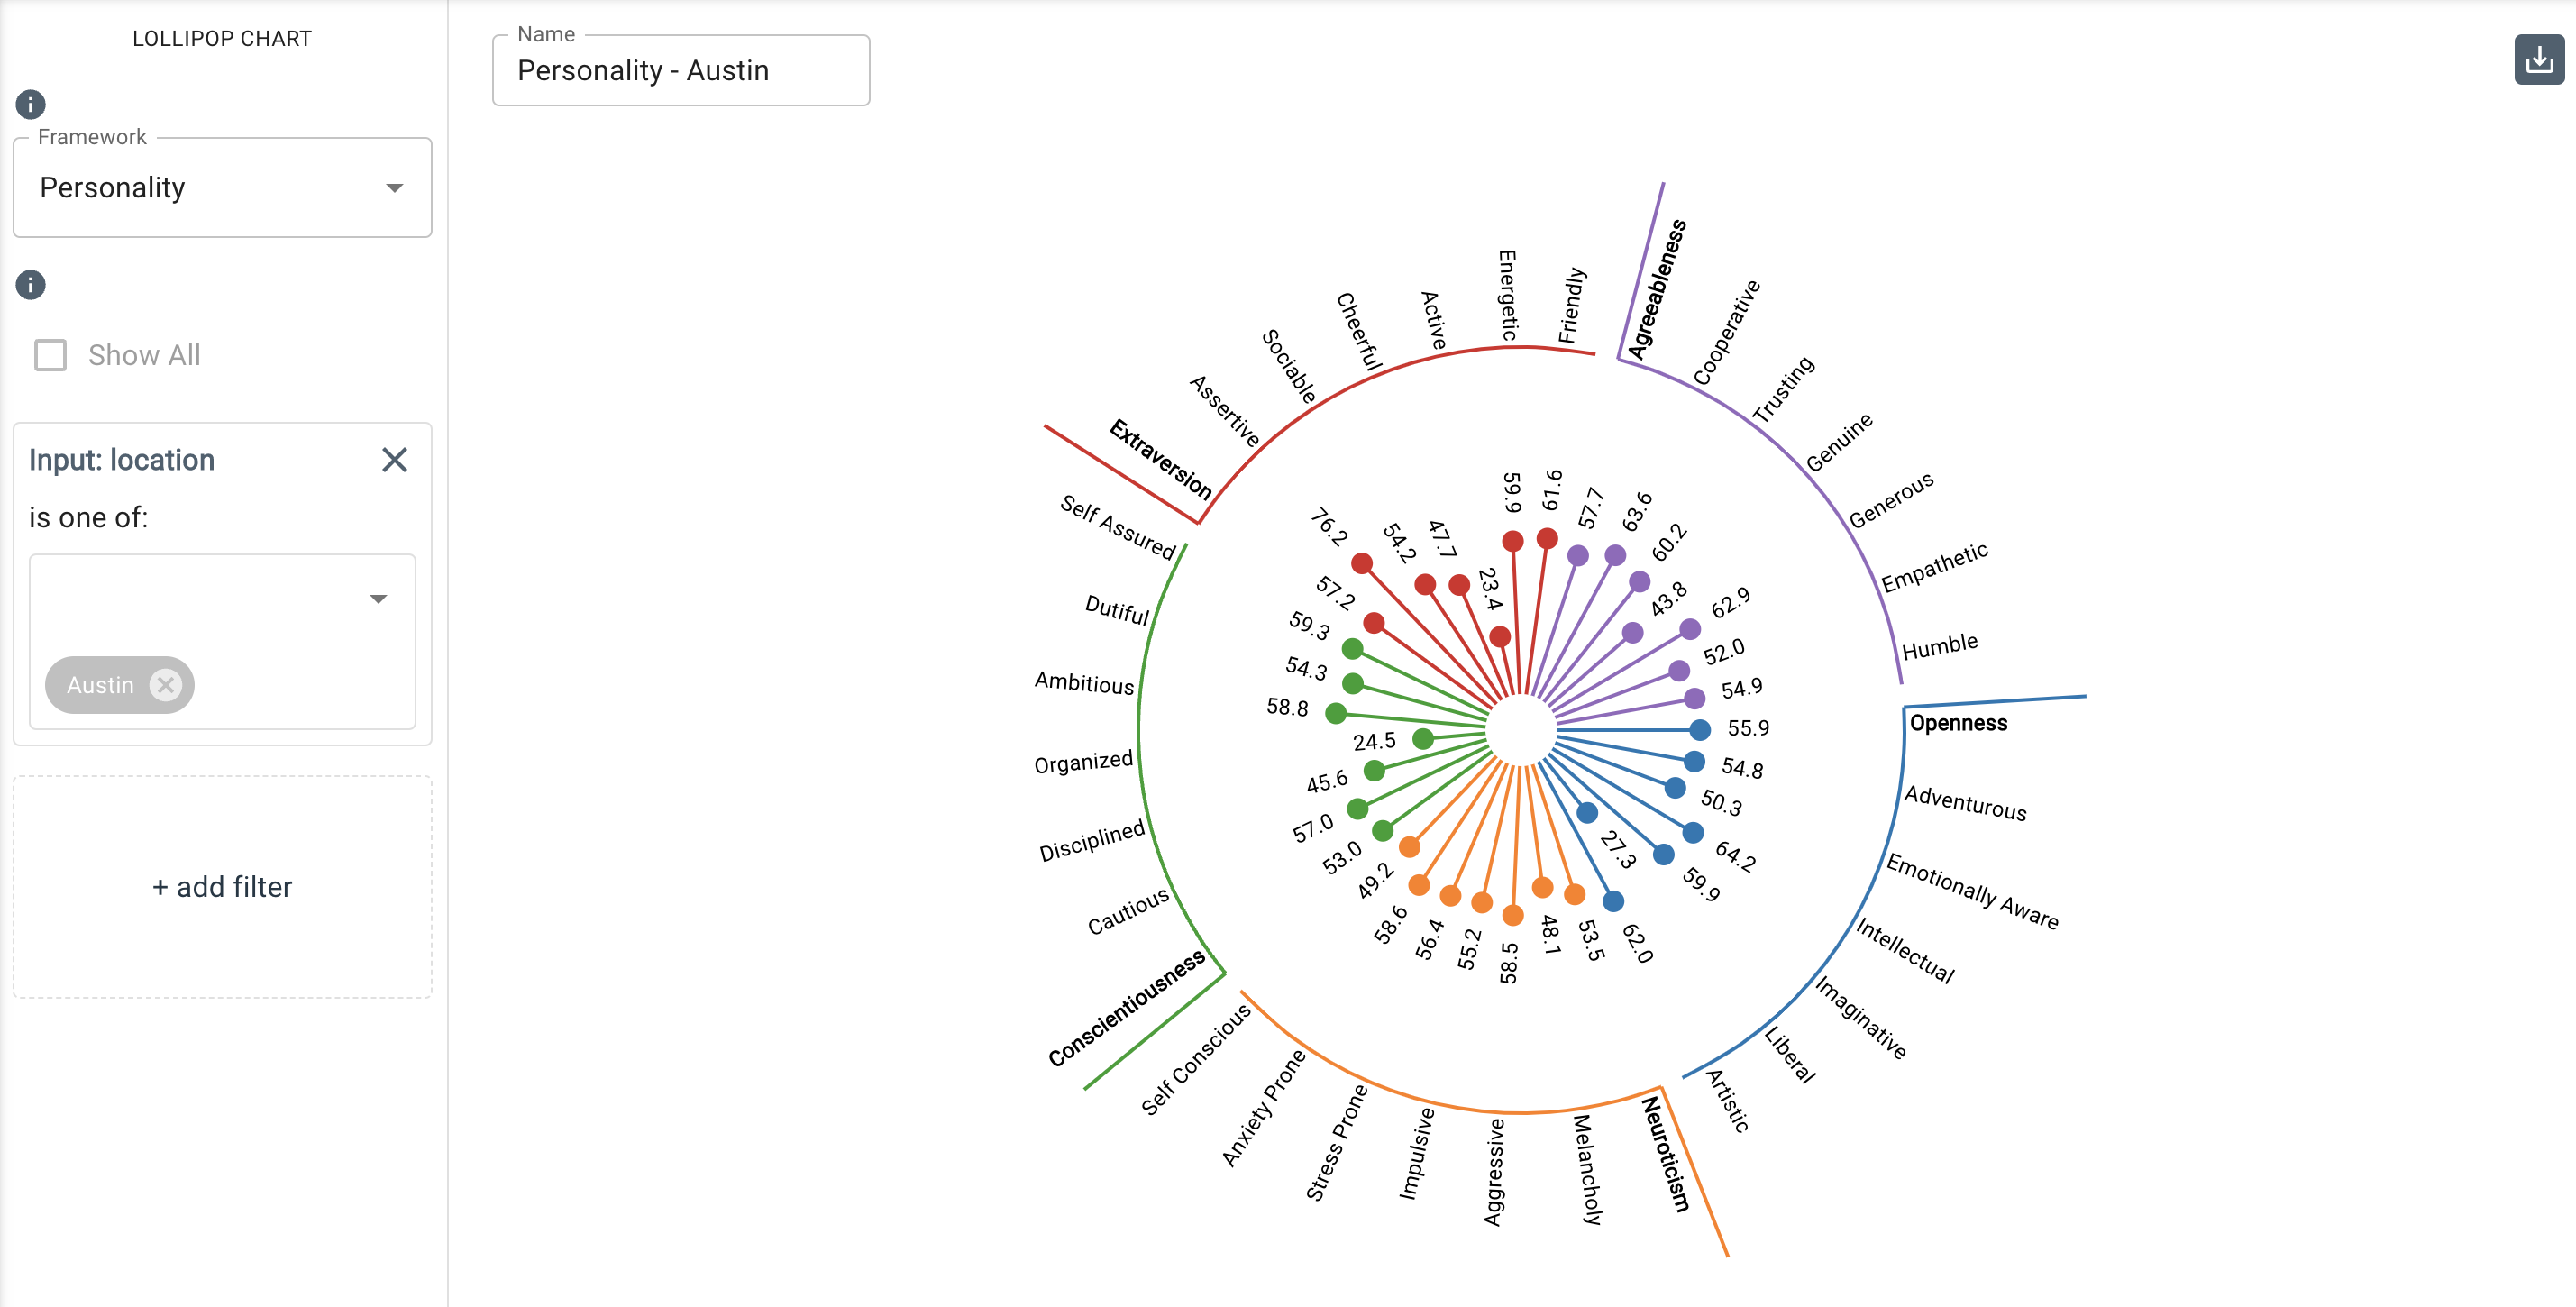
Each data point is represented by a dot at the end of a thin vertical line and the length of the stick represents the value of the data point. The position of the dot indicates its location on the horizontal axis.
In the image below, the Personality measures are filtered on the overall dataset of language from members of the Austin office location of an organization.
Parameters
- The Framework drop-down allows you to select among frameworks that contain normed measures and plots scores for each measure in the framework on the chart.
- The Add Filter option allows you to further filter by categorical input data. For example, if you had many speakers in a meeting and wanted to view the data for a smaller subset or single individual, you could filter them here by clicking Add Filter and selecting your desired input value(s).