Table
The table allows you to compare several measures from datasets with categorical variables for multiple categories such as speaker, gender, office_location, etc. Categories are represented by rows in the table. The table is helpful in comparing how categorical variables score across frameworks and measures and can help identify relatively high or low scores.
Parameters
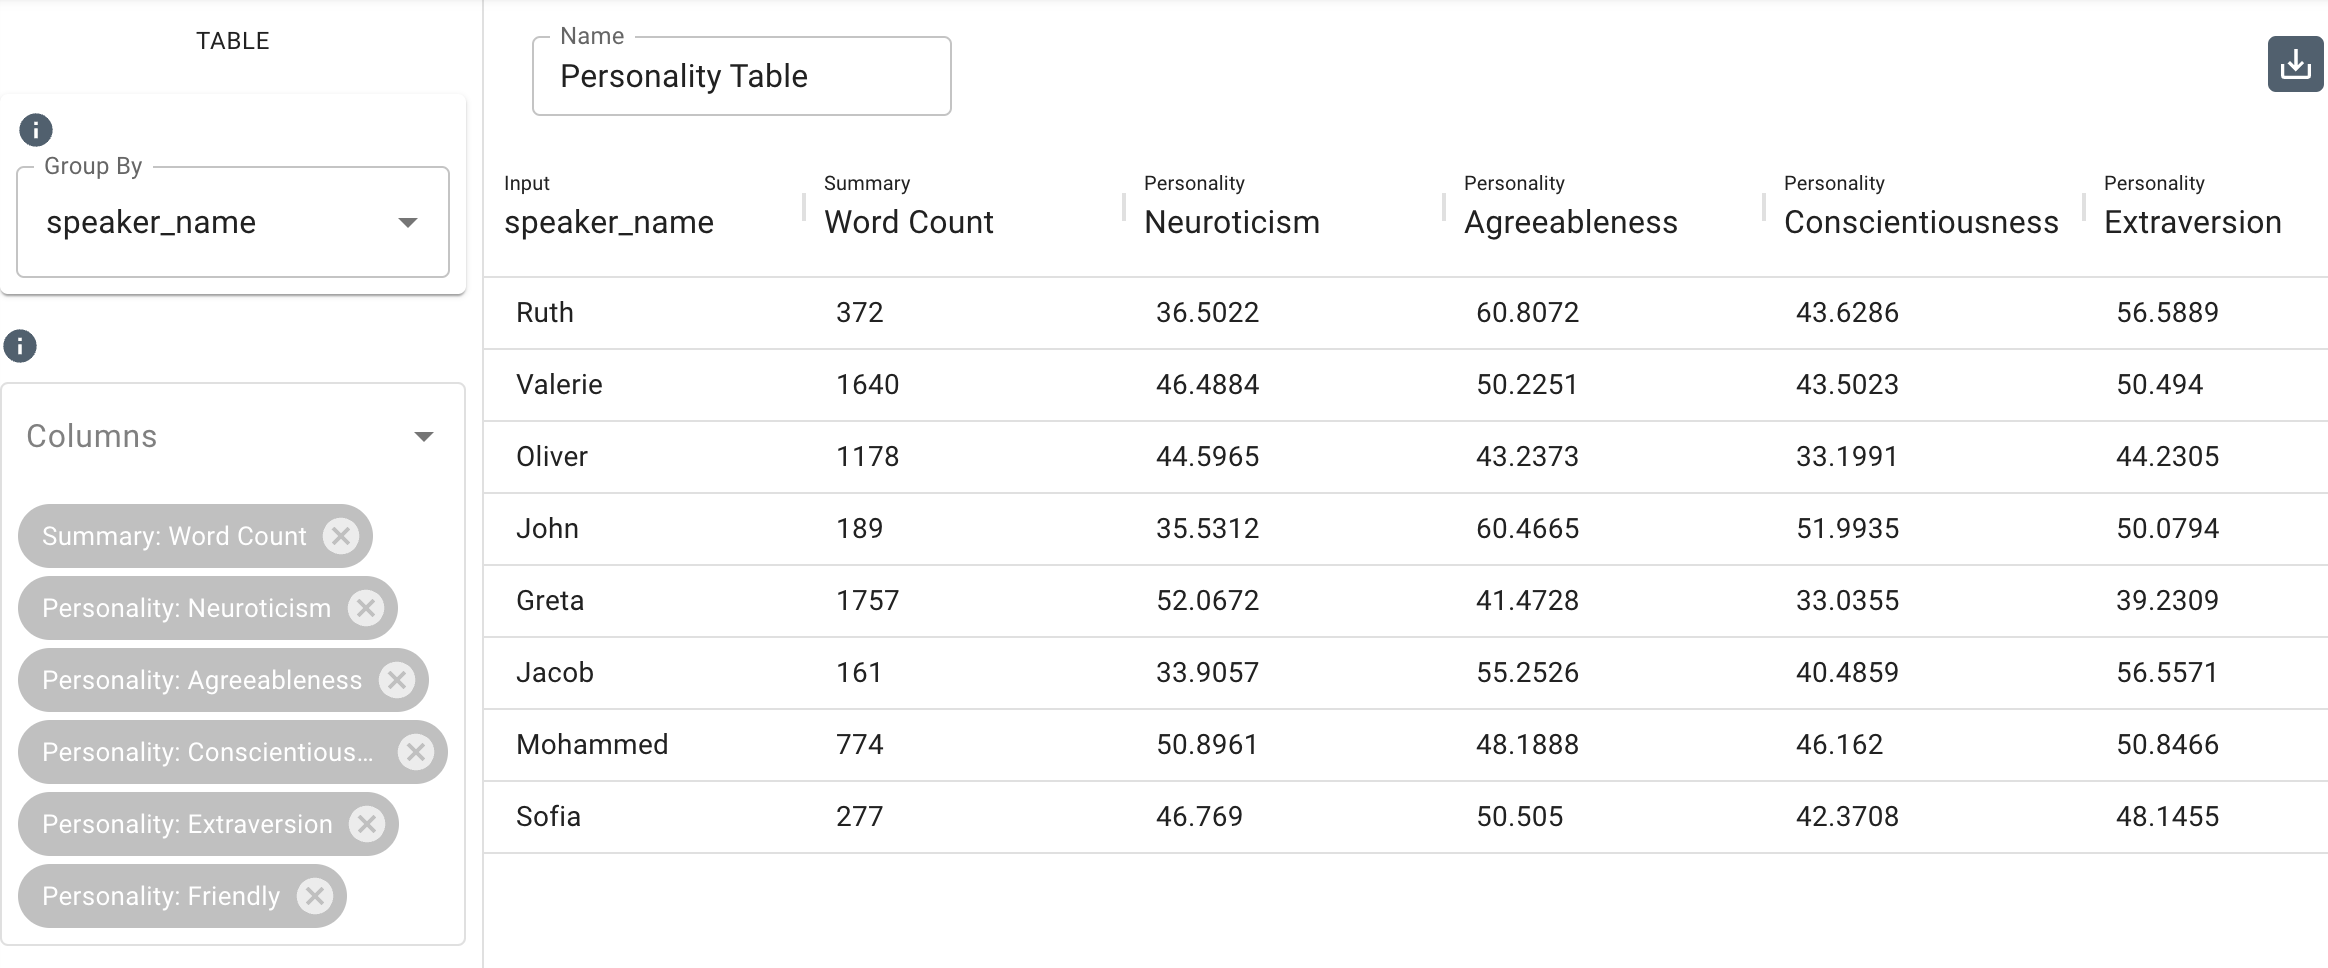
- The Group By drop-down menu allows you to set the column to use to group the chart’s data by selecting either a category such as
speaker_name,gender, or any category your dataset is labeled with. You can also select a taxonomy topic. Note that you can type in this field to search and select an existing category. - The Columns drop-down menu allows you to populate columns in the table by selecting among the measures in frameworks or the topics in taxonomies.
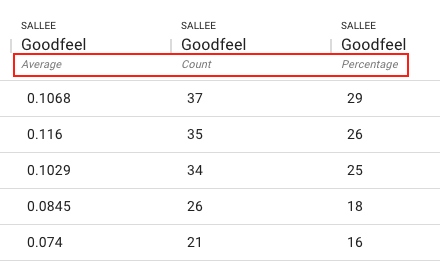
Average, Count, and Percentage
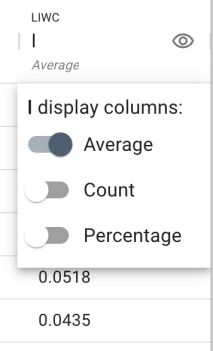
In a table where columns display dictionary-counted measures (excluding Cognition and Additional Indicators), you will see an italicized label under the name of the measure, as well as the eye icon to the right of the measure label. Clicking the icon allows you to toggle between displaying:
- Average: the average of the measure per the metadata category row.
- Count: the number of instances of the chosen measure per the metadata category row. Non-zero scores only.
- Percentage: the percentage of the measure per the metadata category row. Non-zero scores only.
Toggling off the selection will hide the column, while toggling the selection on will produce a new column containing the selection to the right of the current column. In the image below, all three options are toggled on.