Worksheets and Dashboards
Both the worksheets and dashboards allow you to view data by creating different chart types and filtering the data and measures in different ways. Worksheets are simply a place to create one large chart, table, or graph, while dashboards provide a space to create and combine different worksheets.
Worksheets
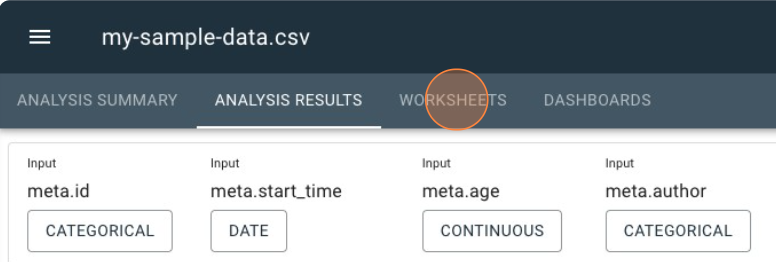
To access the chart, table, and graphing tools for worksheets:
-
In an active project, click the Worksheets tab.
-
In the new blank page, click the Create Worksheet icon.

-
Choose a chart, table, or graph you’d like to visualize your data on.
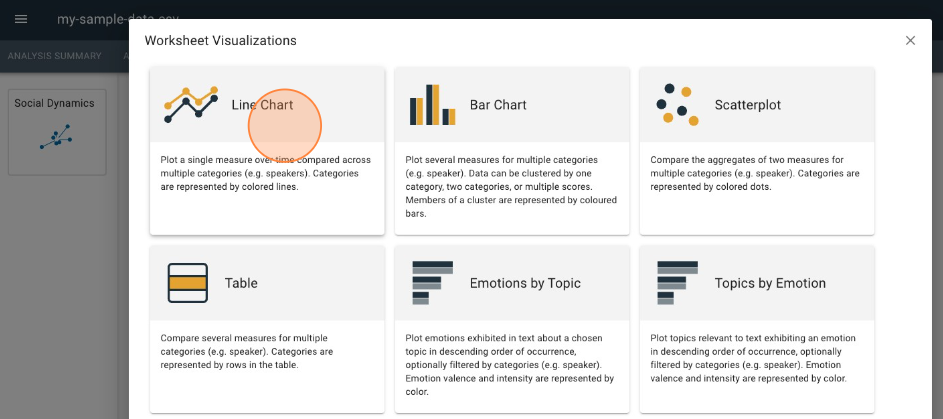
See the video below for a walk-through of how to create a visualization from within the Worksheets tab:
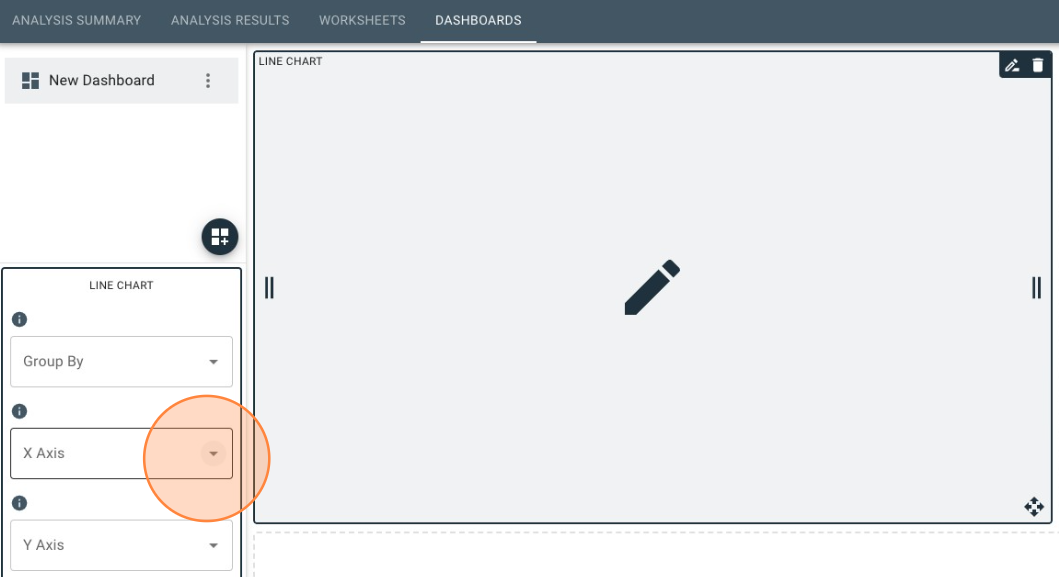
Dashboards
To access the chart, table, and graphing tools for dashboards:
-
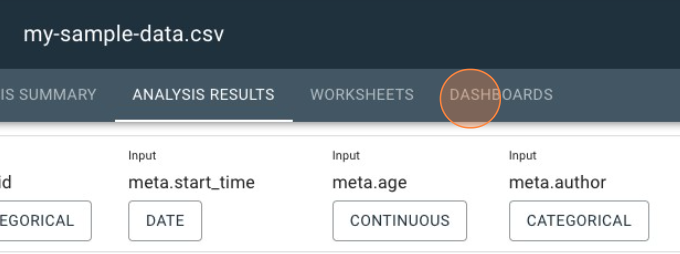
In an active project, click the Dashboards tab.
-
Click the Create Dashboard icon

-
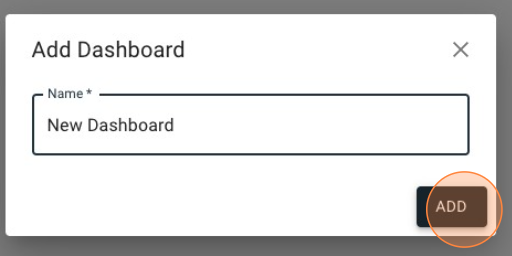
After naming your dashboard, click Add.
-
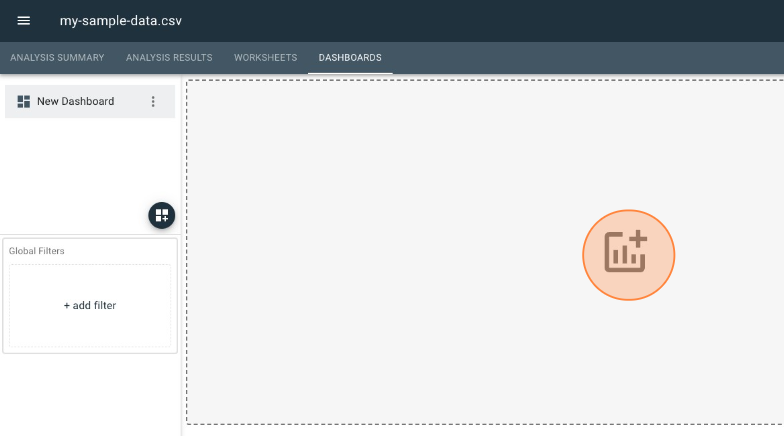
In the new worksheet placeholder, click the Add Worksheet button.
-
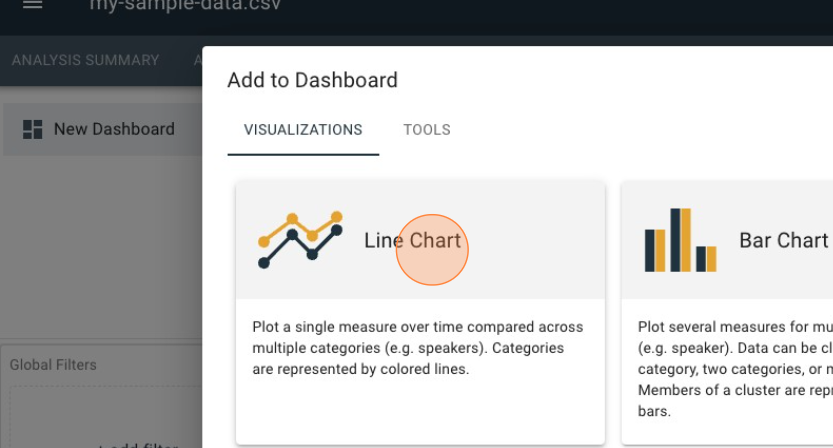
In the Add to Dashboard menu, select one that you want to use.
-
The tools to analyze and filter results will display on the left of the UI for the chart-type you selected.
See the video below for a walk-through of how to create a visualization from within the Dashboards tab:
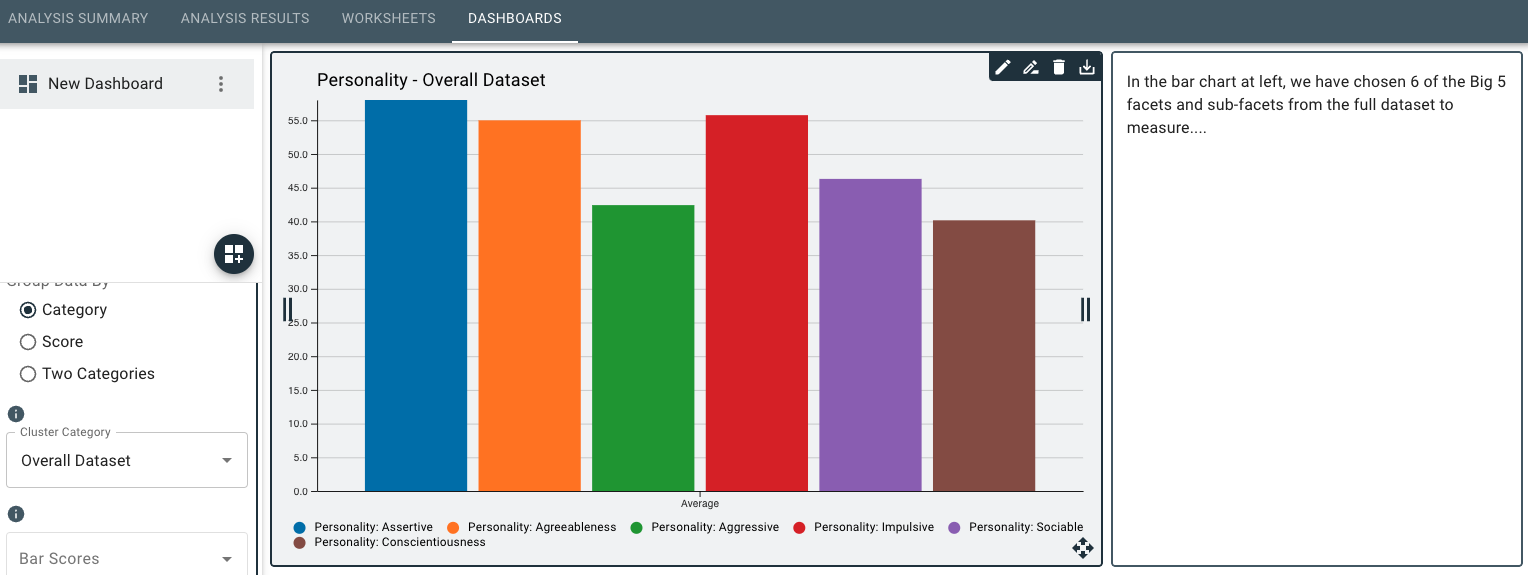
Dashboard Features
The dashboard contains the same set of tools and features as found in the worksheets — the difference being that you can view and arrange several different worksheets on the same page in several different configurations. The width of a worksheet can be sized to be small, medium, or large. The largest width takes an entire row, while the smallest allows for three worksheets to fit in a row.
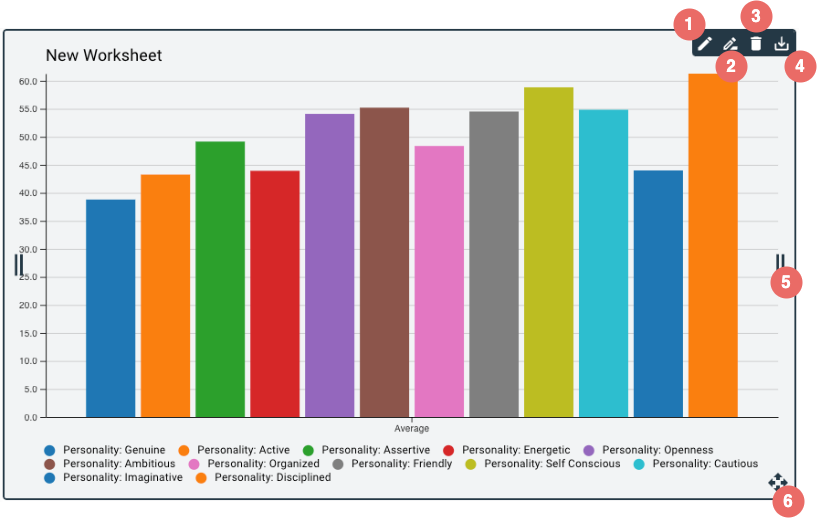
Worksheet tools
- Edit worksheet content and settings.
- Rename worksheet.
- Delete worksheet.
- Save worksheet as image file to your computer.
- Resize worksheet by clicking and dragging them left or right.
- Rearrange worksheet on the dashboard by dragging and dropping them laterally or vertically.
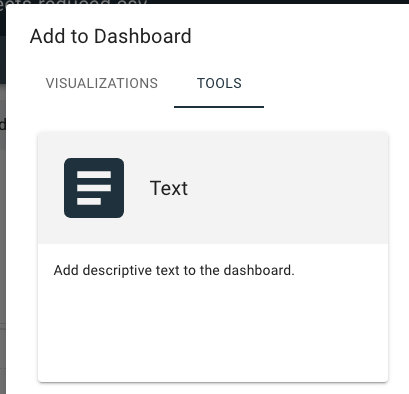
Text Tool for Dashboard Descriptors
By adding a text window to your dashboard, you can include customized text descriptions that provide additional context and insights for yourelf and your viewers. In the Add to Dashboard dialog, simply click Tools, then click Text and your text window will appear in your dashboard.