Creating a Project
Once logged in, you can choose to either score a language dataset or start a visualization project.
Scoring a Language Dataset
The Receptiviti UI allows you to not only upload datasets for visualization projects, but to score your data set via the Receptiviti API all within the user interface.
From the homepage, click either the Score tab in the top navigation bar or the Score Language button to access language scoring features.
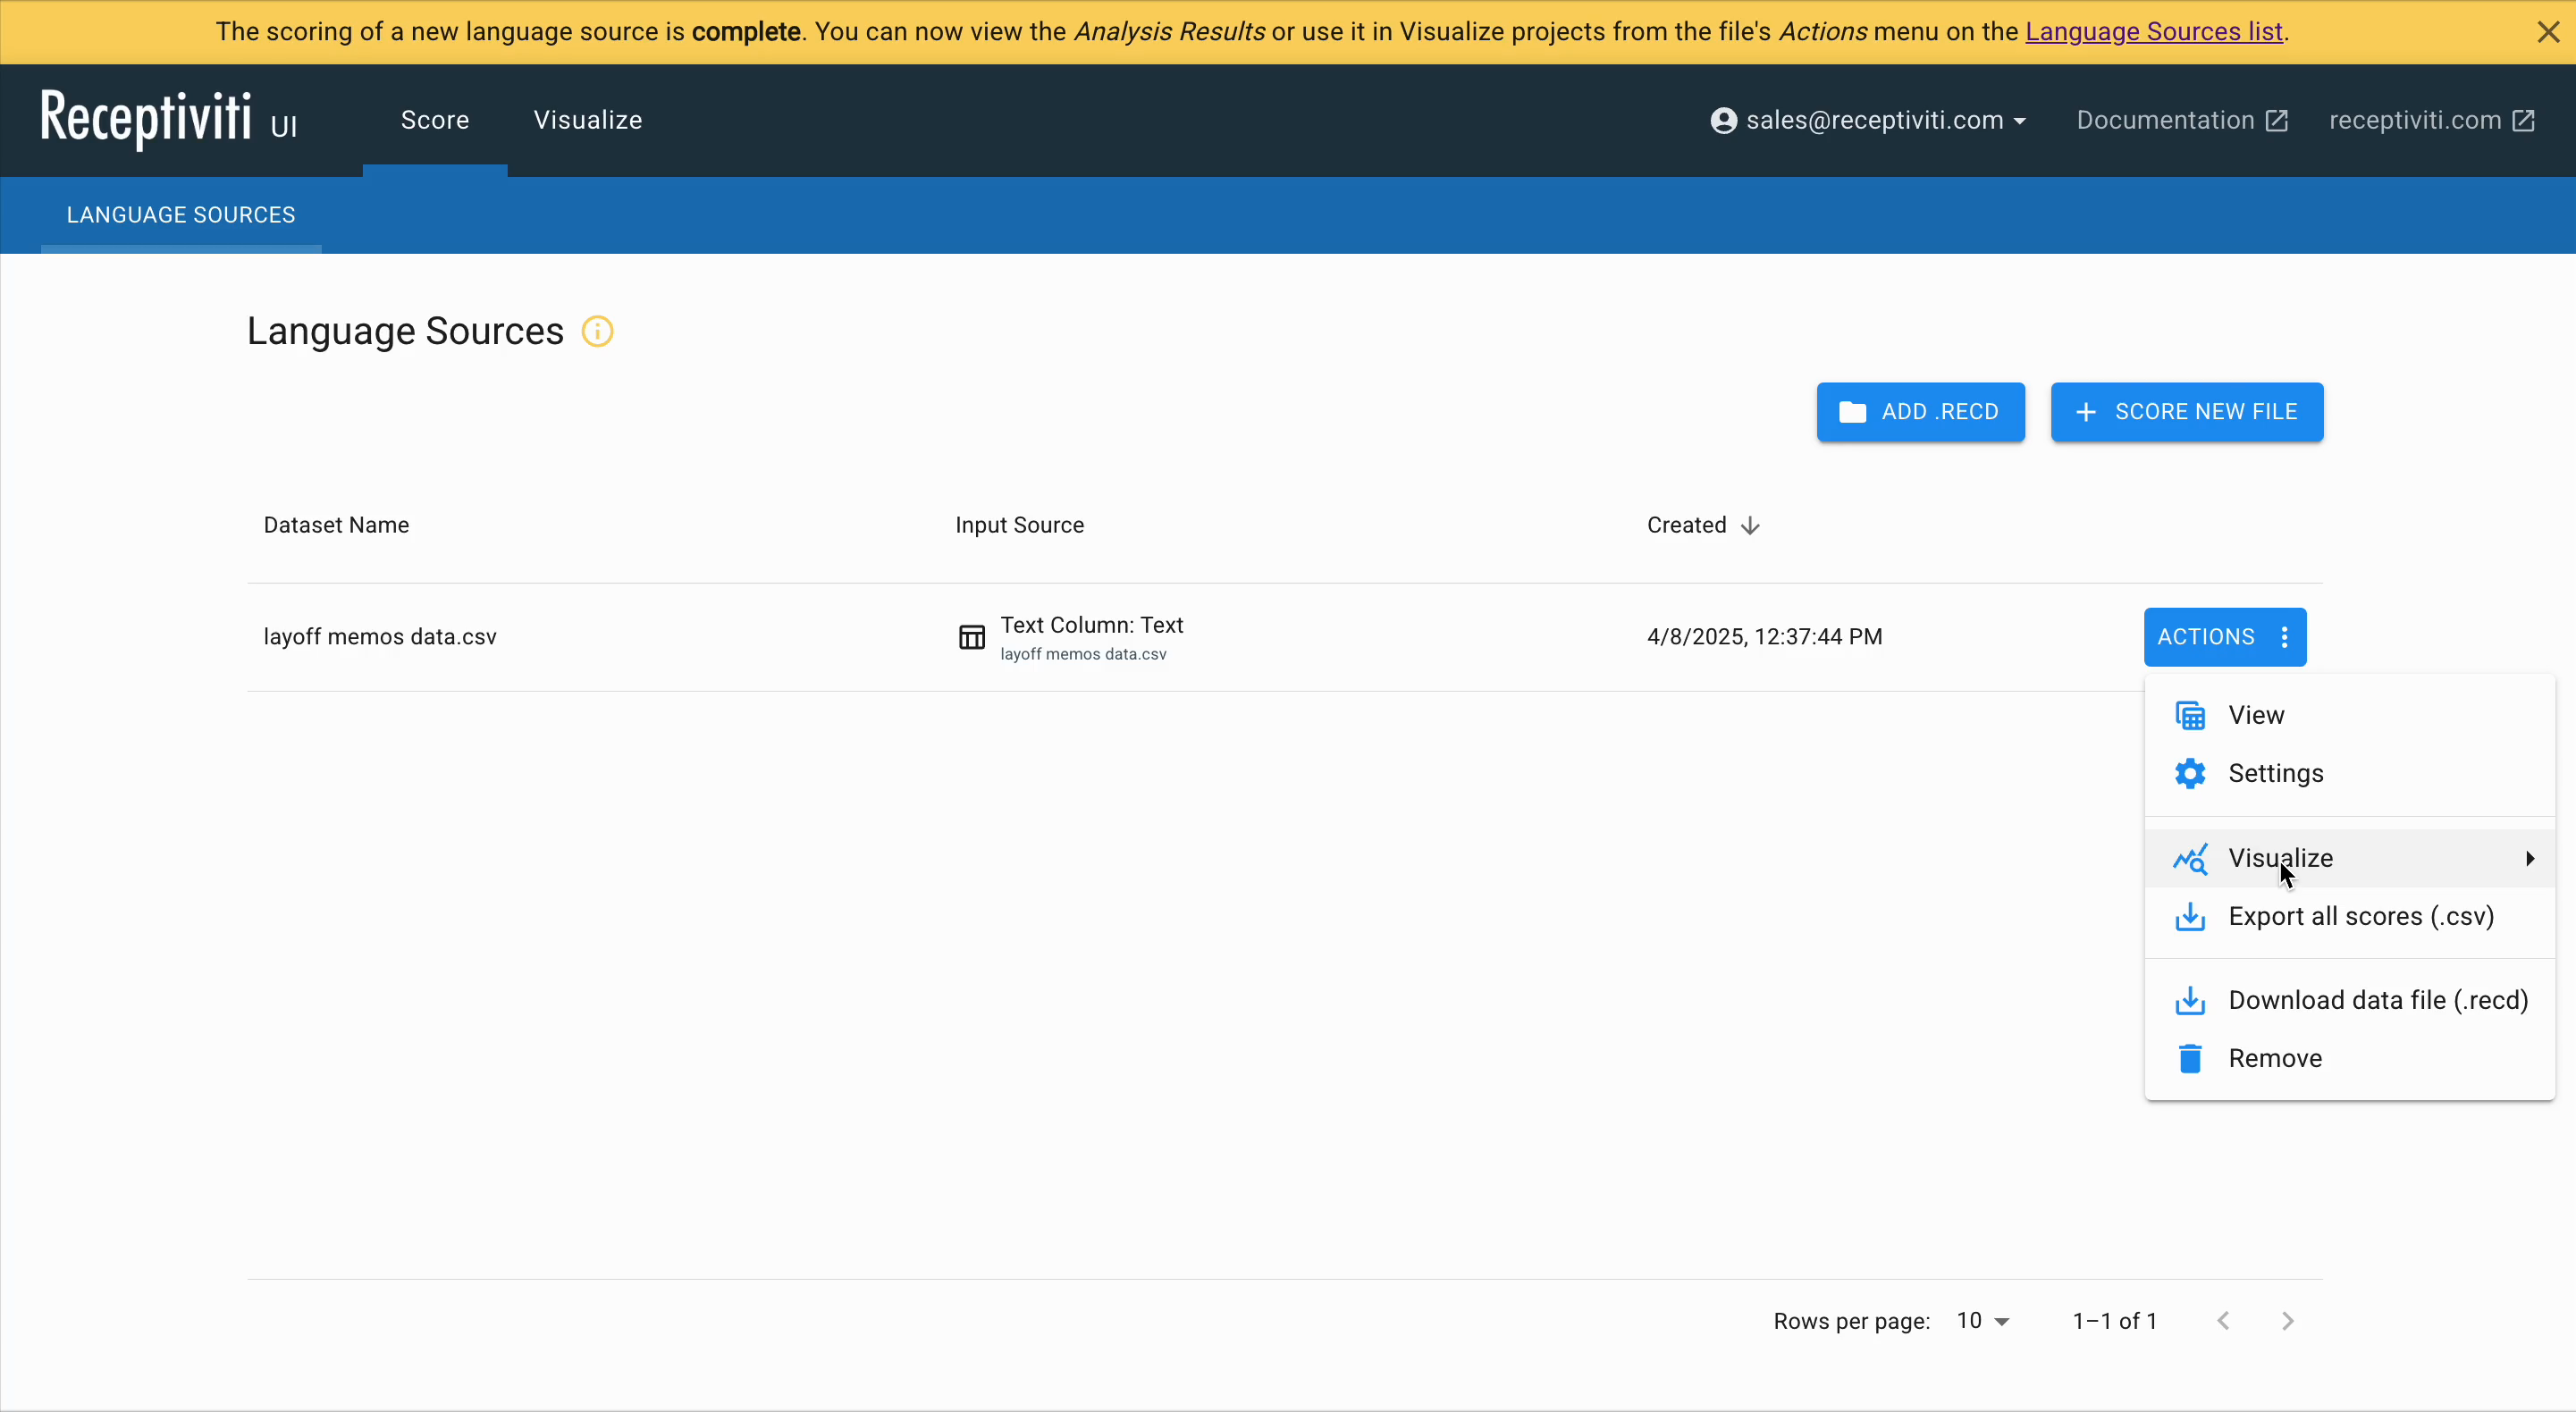
The Language Sources Page
When scoring a dataset through the Receptiviti UI, you can either add an existing Receptiviti data file (.recd) or score a new file.
To create a new project from an existing scored language file, click the Actions button next to the file you'd like to use. To score a new file, click Score New File.
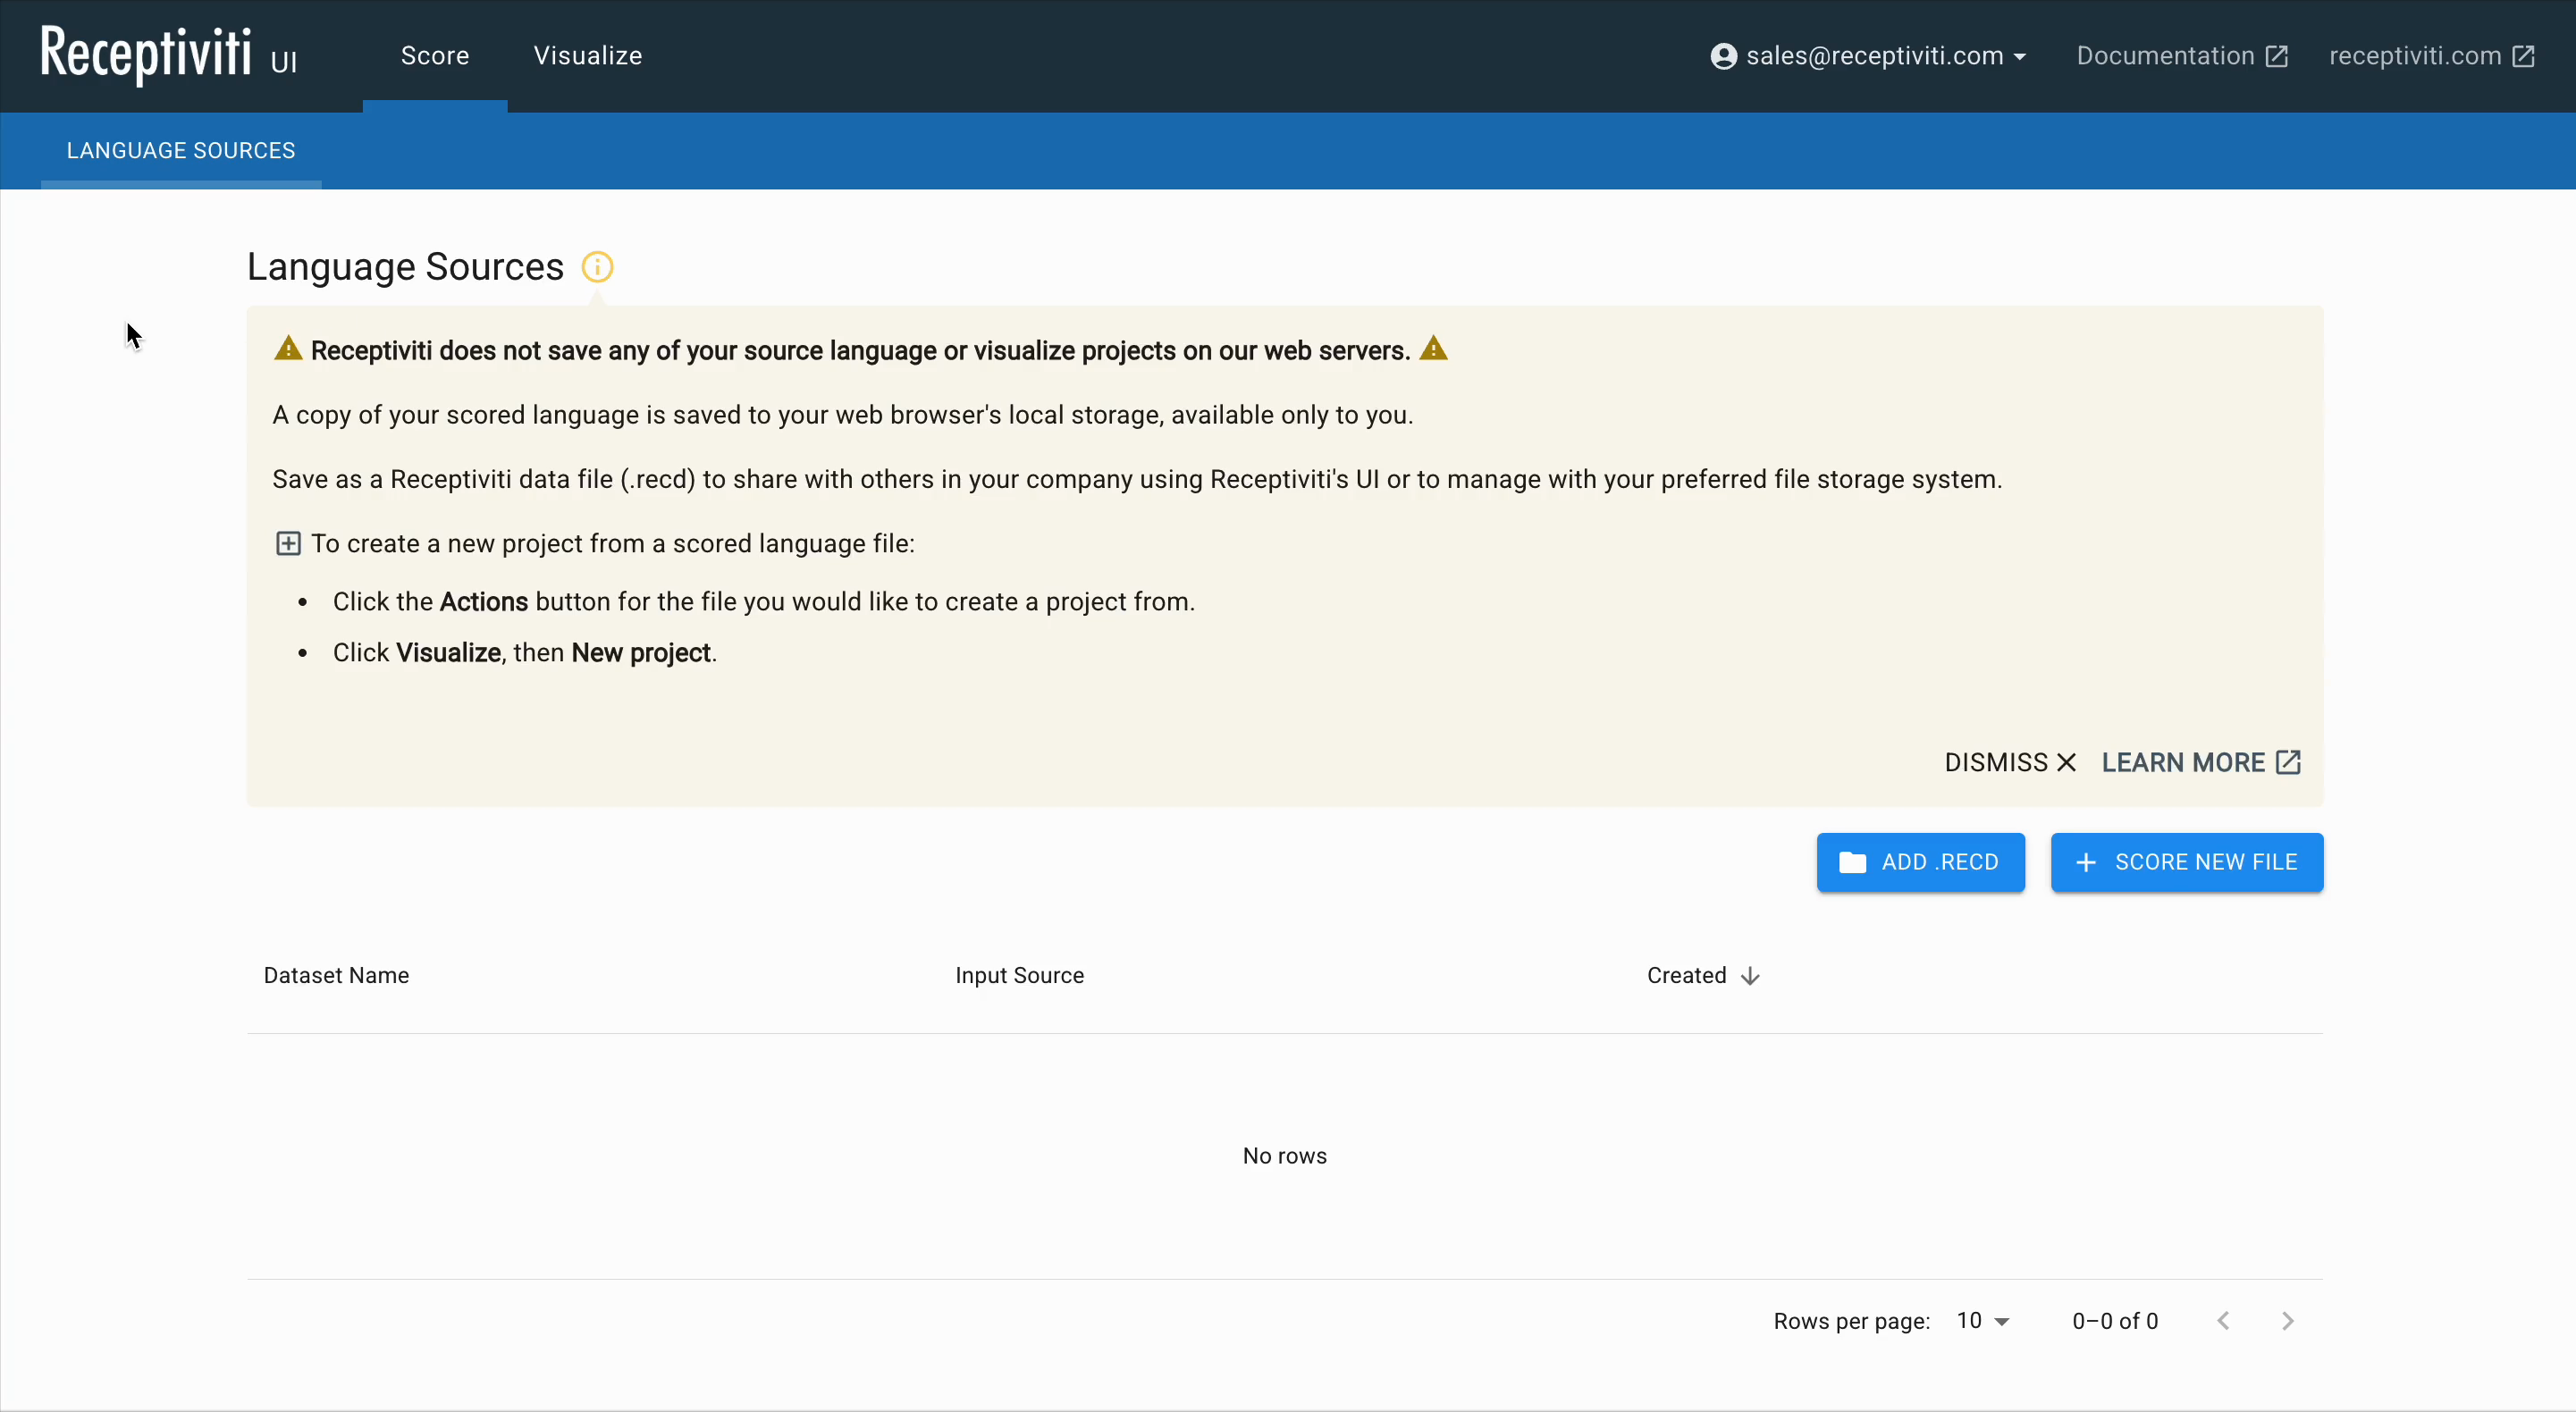
Receptiviti does not save any of your language source or visualization projects on its web servers. A copy of your scored language is saved to your web browser's local storage and is available only to you.
It's good practice to regularly save your work manually to your hard drive as .recd files. These serve as backups of your scored language data and can be re-uploaded later if needed.
The Select Data File Page
Once you've clicked Score New File, this leads to the Select Data File page, where you can upload your file. The maximum allowable file size is 10 MB. You must upload a CSV (comma-separated values) file with a header row. For transcripts, acceptable formats include:
- VTT (from Zoom)
- JSON (from Symbol.ai)
- CSV with columns for timestamps, speaker name, and other metadata
Click Select File to browse your system for your upload, and select the appropriate Value delimiter that matches your dataset: comma, semicolon, tab, or vertical bar.
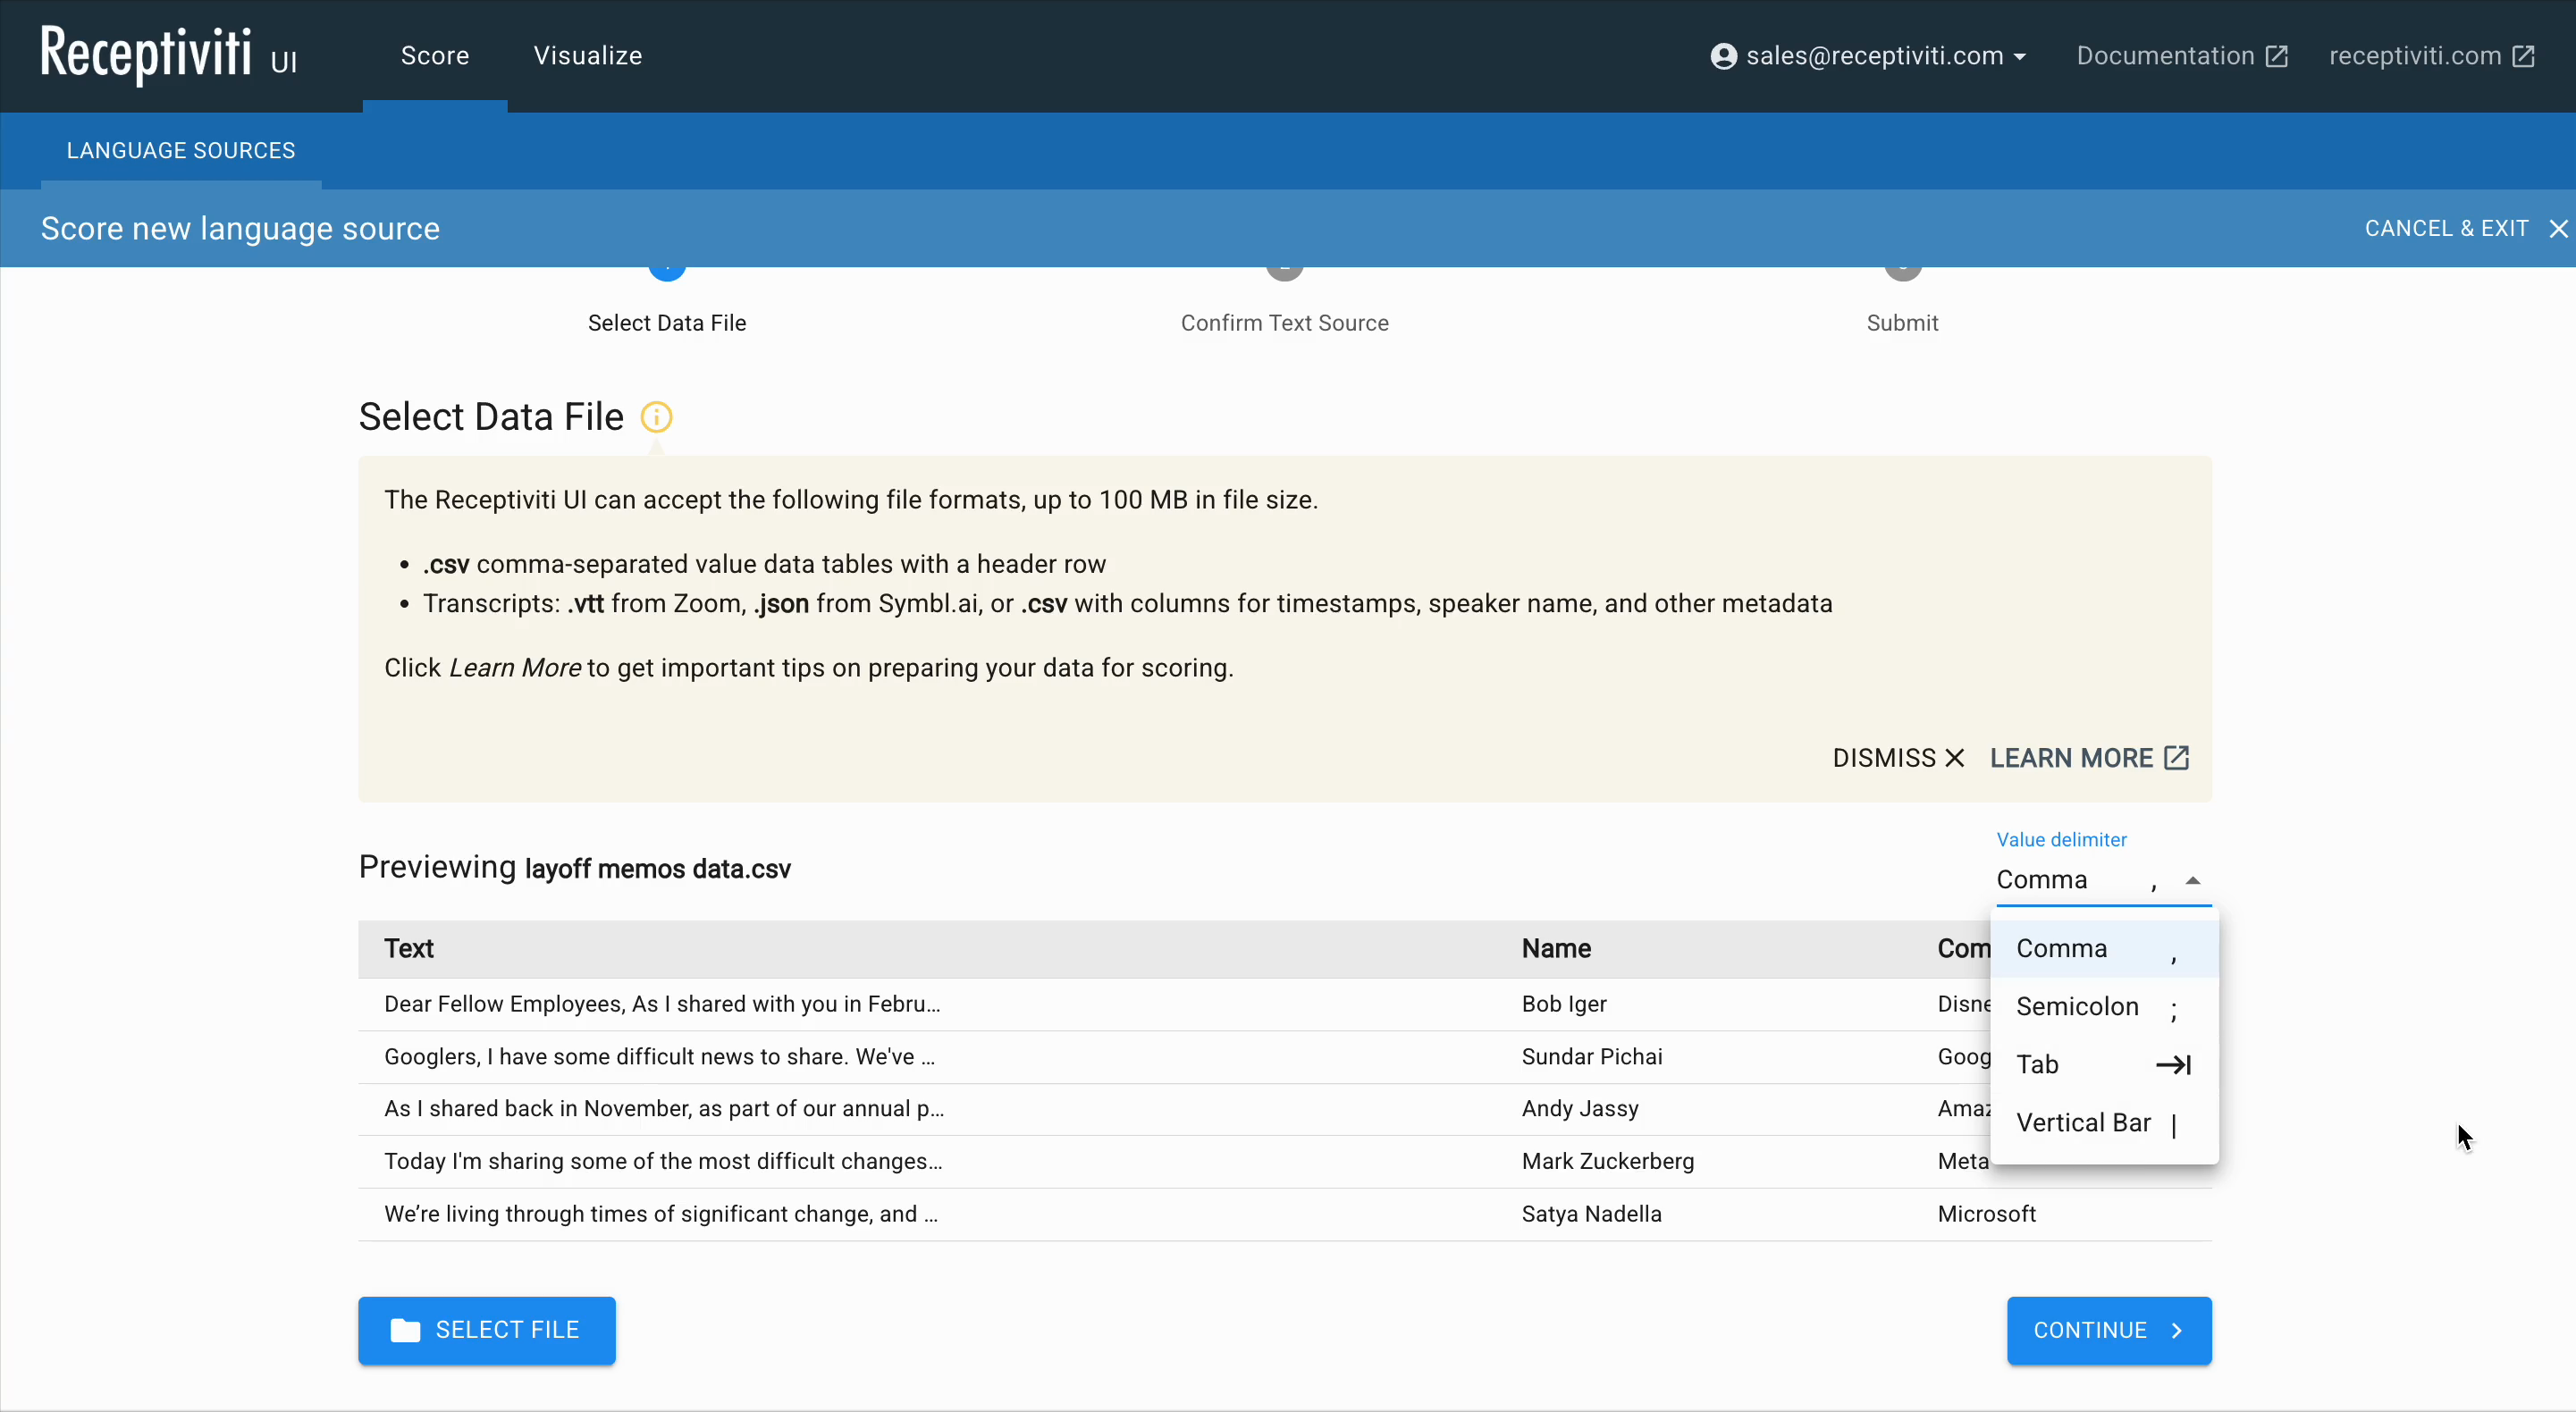
Select the column you want to analyze. Only one column can be selected. If you wish to analyze multiple columns of text, use spreadsheet software of your choice to merge them into a single column and export a new CSV.
For very large files, try a test run with a smaller subset of your data.
Each column will be validated and classified as one of the following:
- Text – input language eligible for analysis
- Categorical – metadata for aggregation or filtering
- Numeric – numerical metadata
- Date – timestamps or date-based metadata
If a column isn't classified correctly, it may be due to formatting issues in your file. Check the Troubleshooting section under Learn More for help.
You'll also see:
- The word count selected for analysis
- The number of words available in your current billing cycle
- The estimated remaining words after this analysis
Click Continue to proceed to the Confirm Submission page.
The Confirm Submission page
Here, you can name your dataset, verify the selected input file and text column, and choose a norming context.
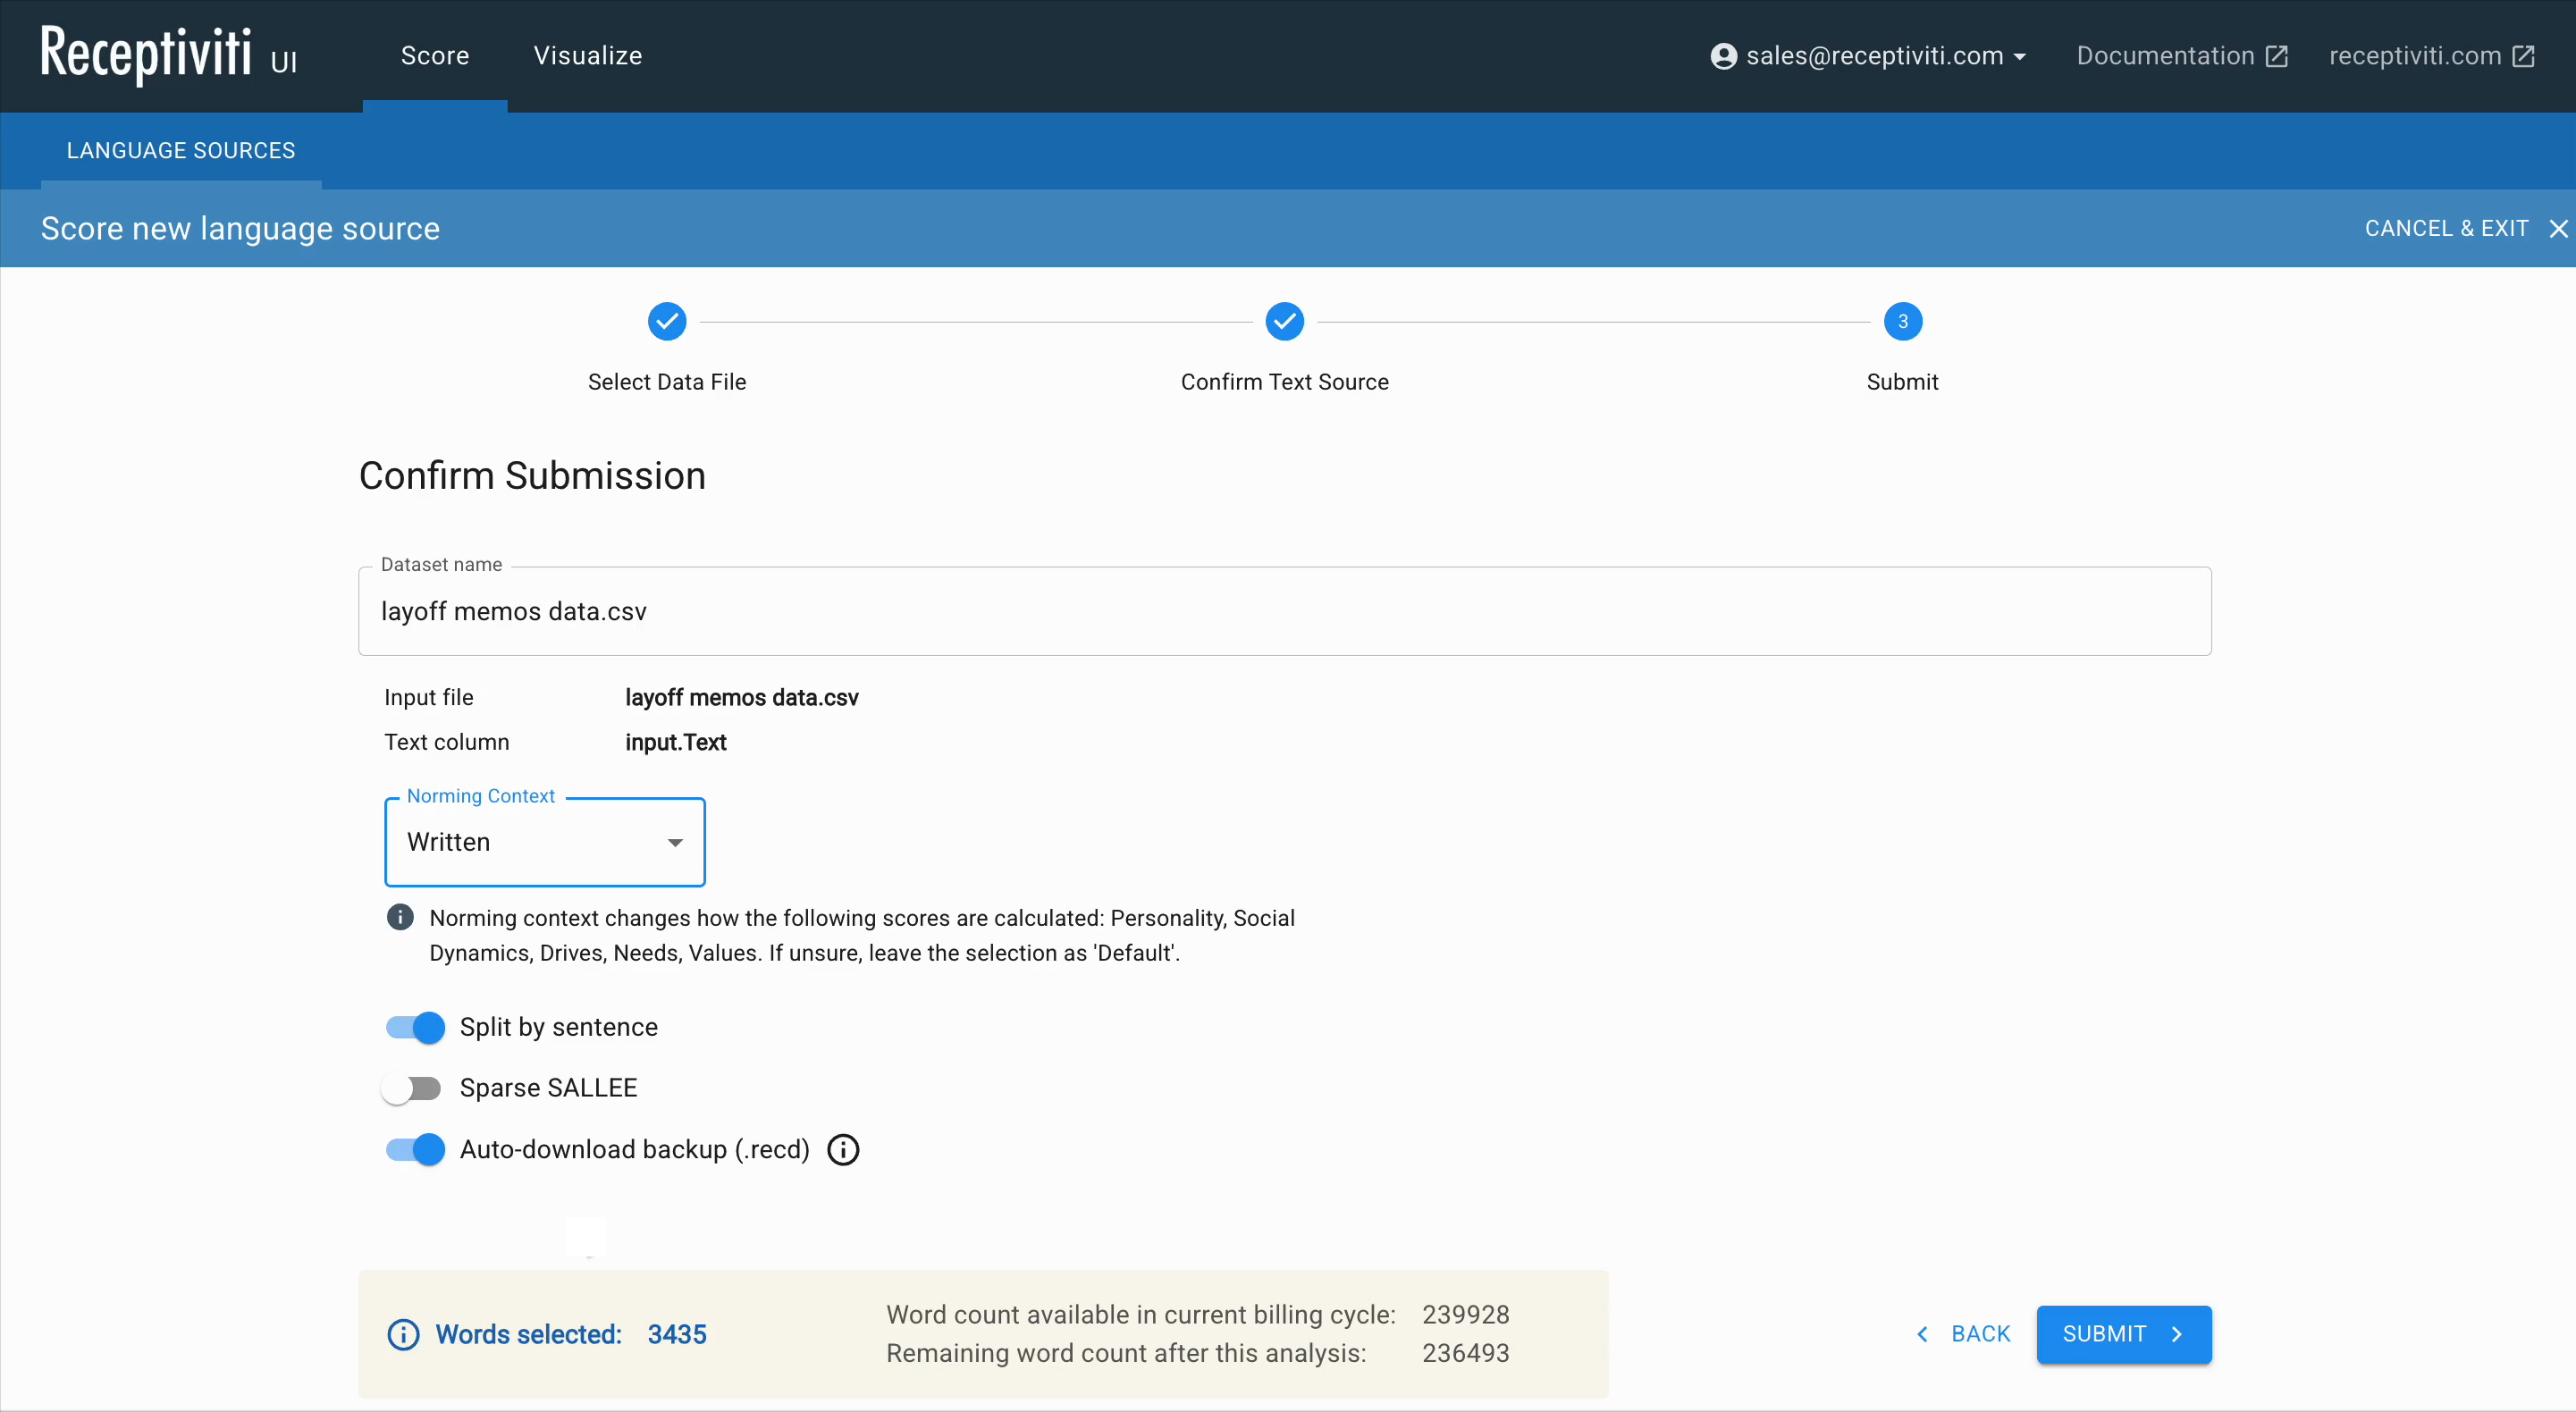
If your language dataset contains written memos, emails, etc., choose the written context; for spoken transcripts, choose spoken. These contexts affect how normed scores like Personality, Social Dynamics, Drives, Needs, and Values are interpreted.
You can also:
- Toggle Split by Sentence (This option splits your text into individual sentences, allowing you to view insights for each sentence rather than treating the entire text as a single unit.)
- Choose to auto-download a backup
.recdfile
When you're ready, click Submit.
Scoring Complete
After submission, a banner will confirm that the analysis is complete. You can now:
- View analysis results
- Use the data in Visualization Projects
- Access the analyzed files available in the Language Sources list
There, you'll see:
- Dataset name
- Creation date
- Input source
Back in Language Sources, click Actions to:
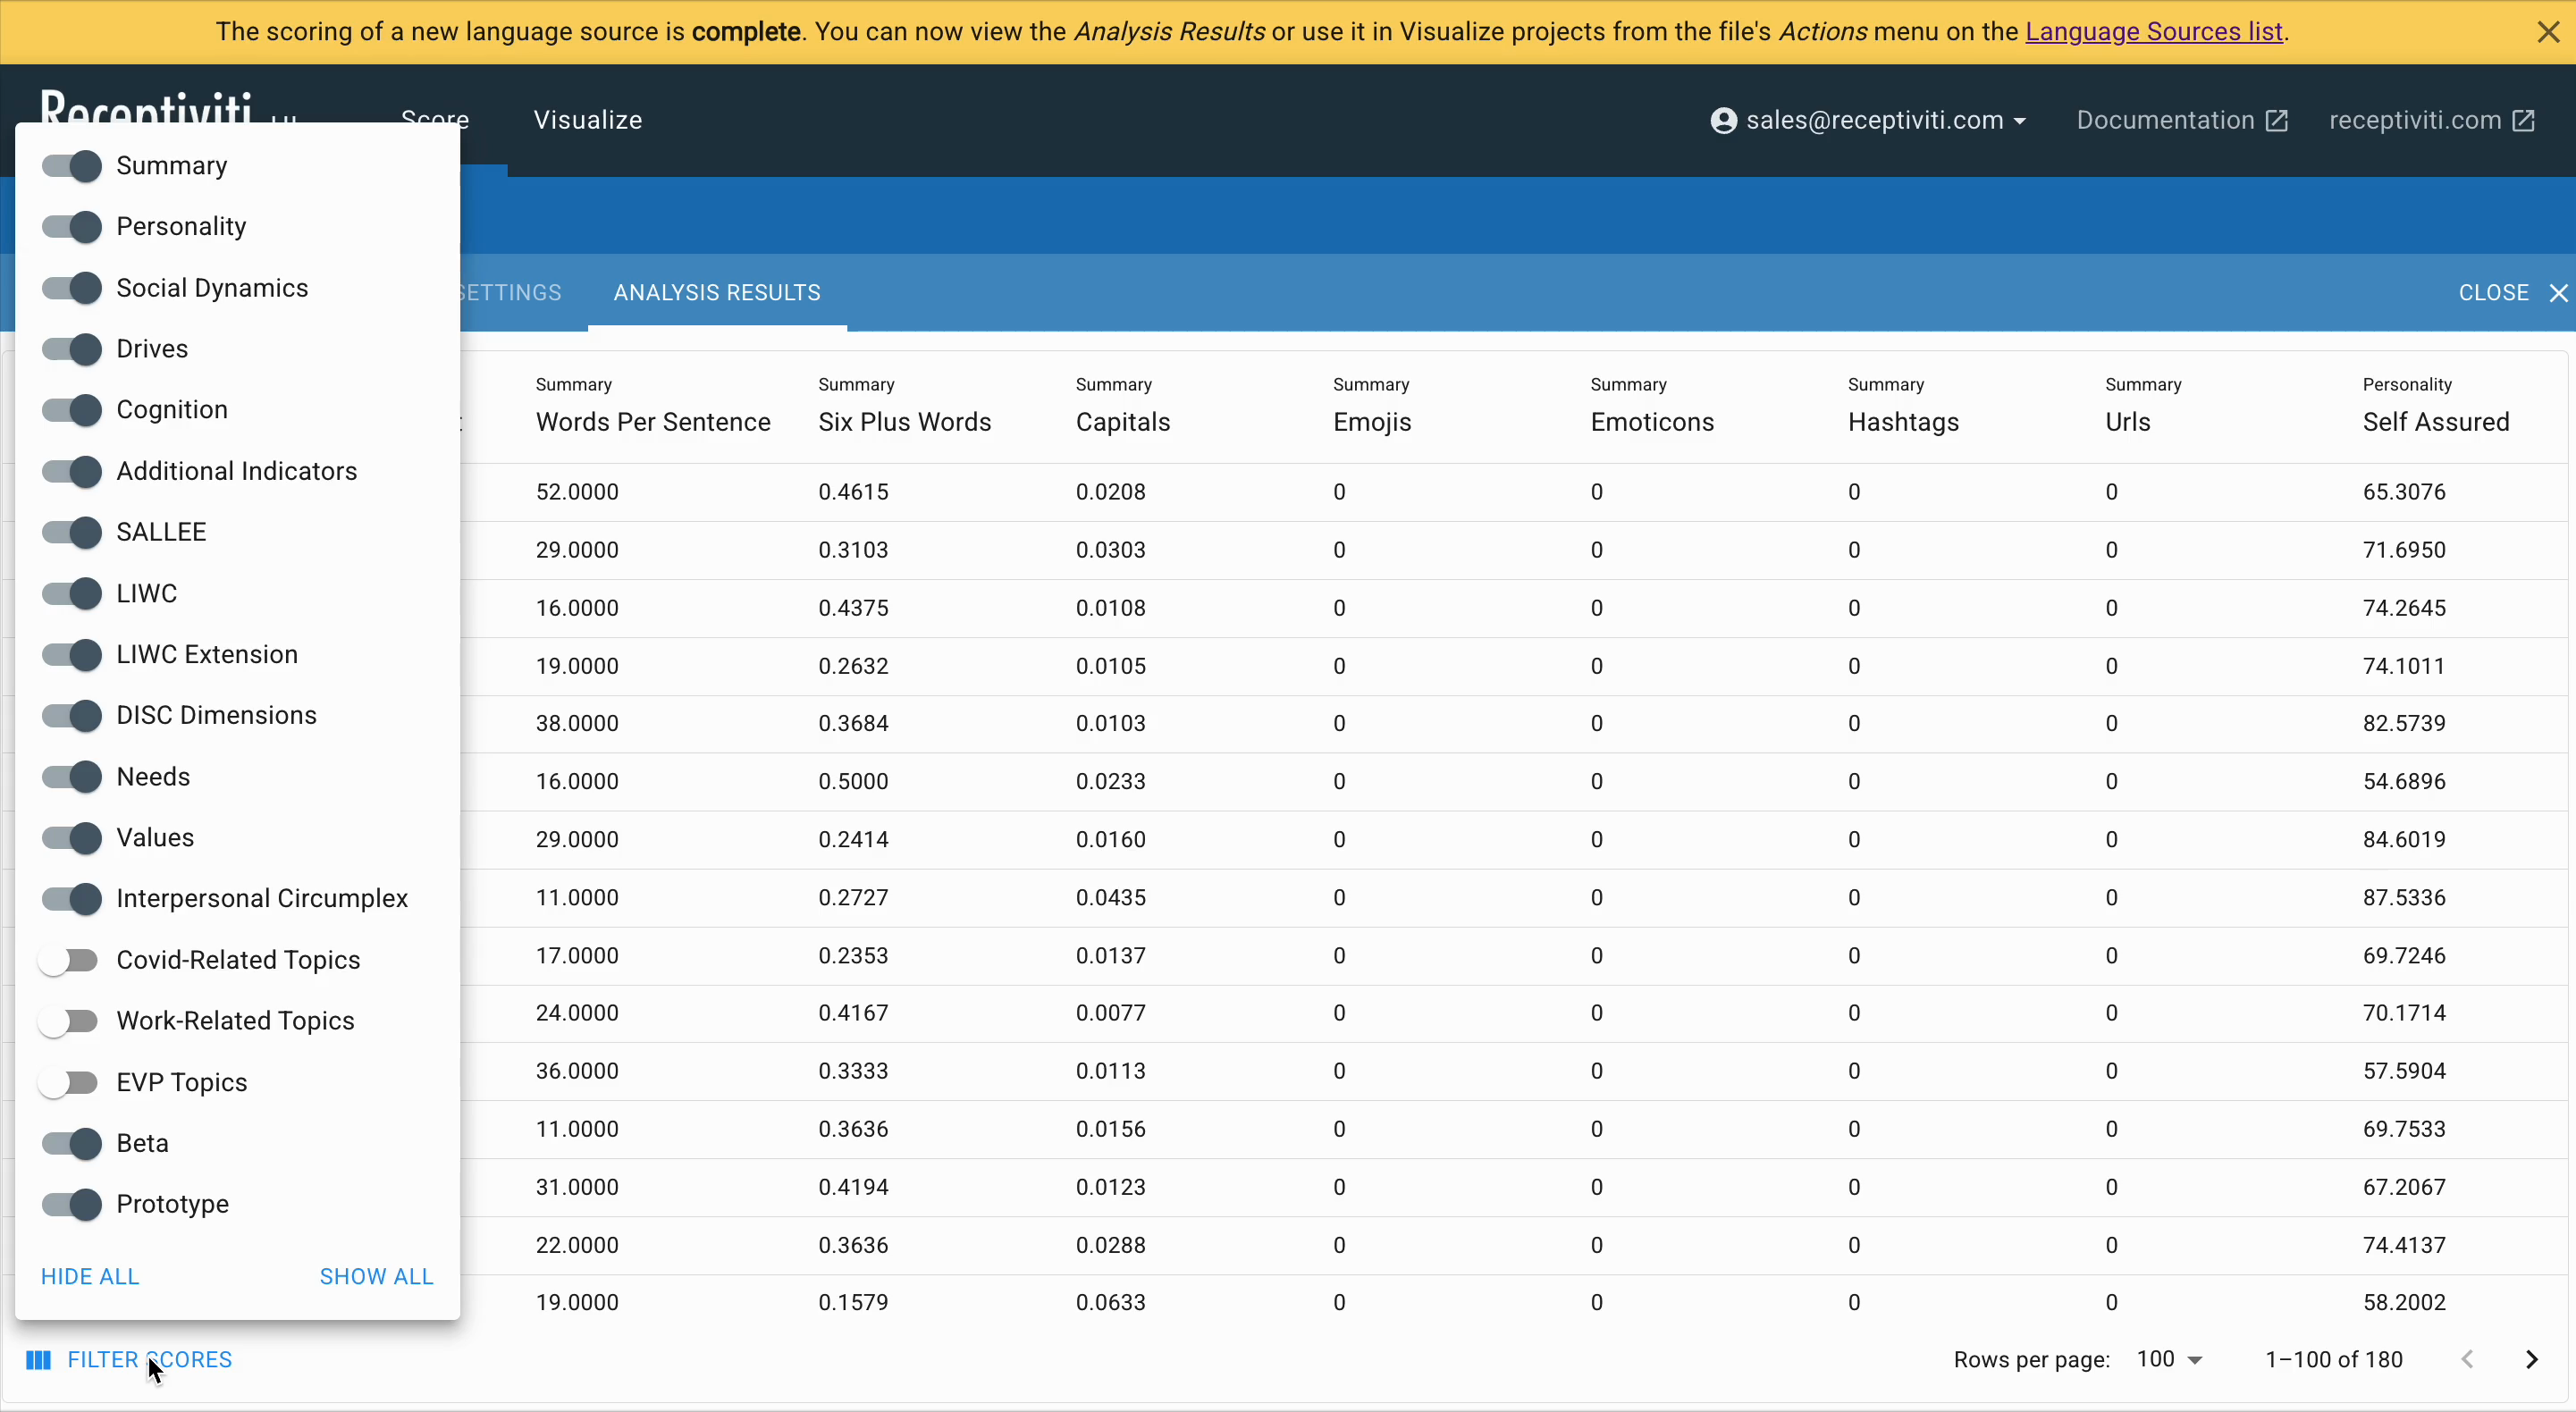
- View the full file (split by sentence if selected, with metadata and scores)
- Toggle framework filters on and off
- Start a new visualization project
- Export scores to CSV
- Download the
.recdfile - Delete the dataset
If you choose to export, the scored CSV will download to your hard drive.
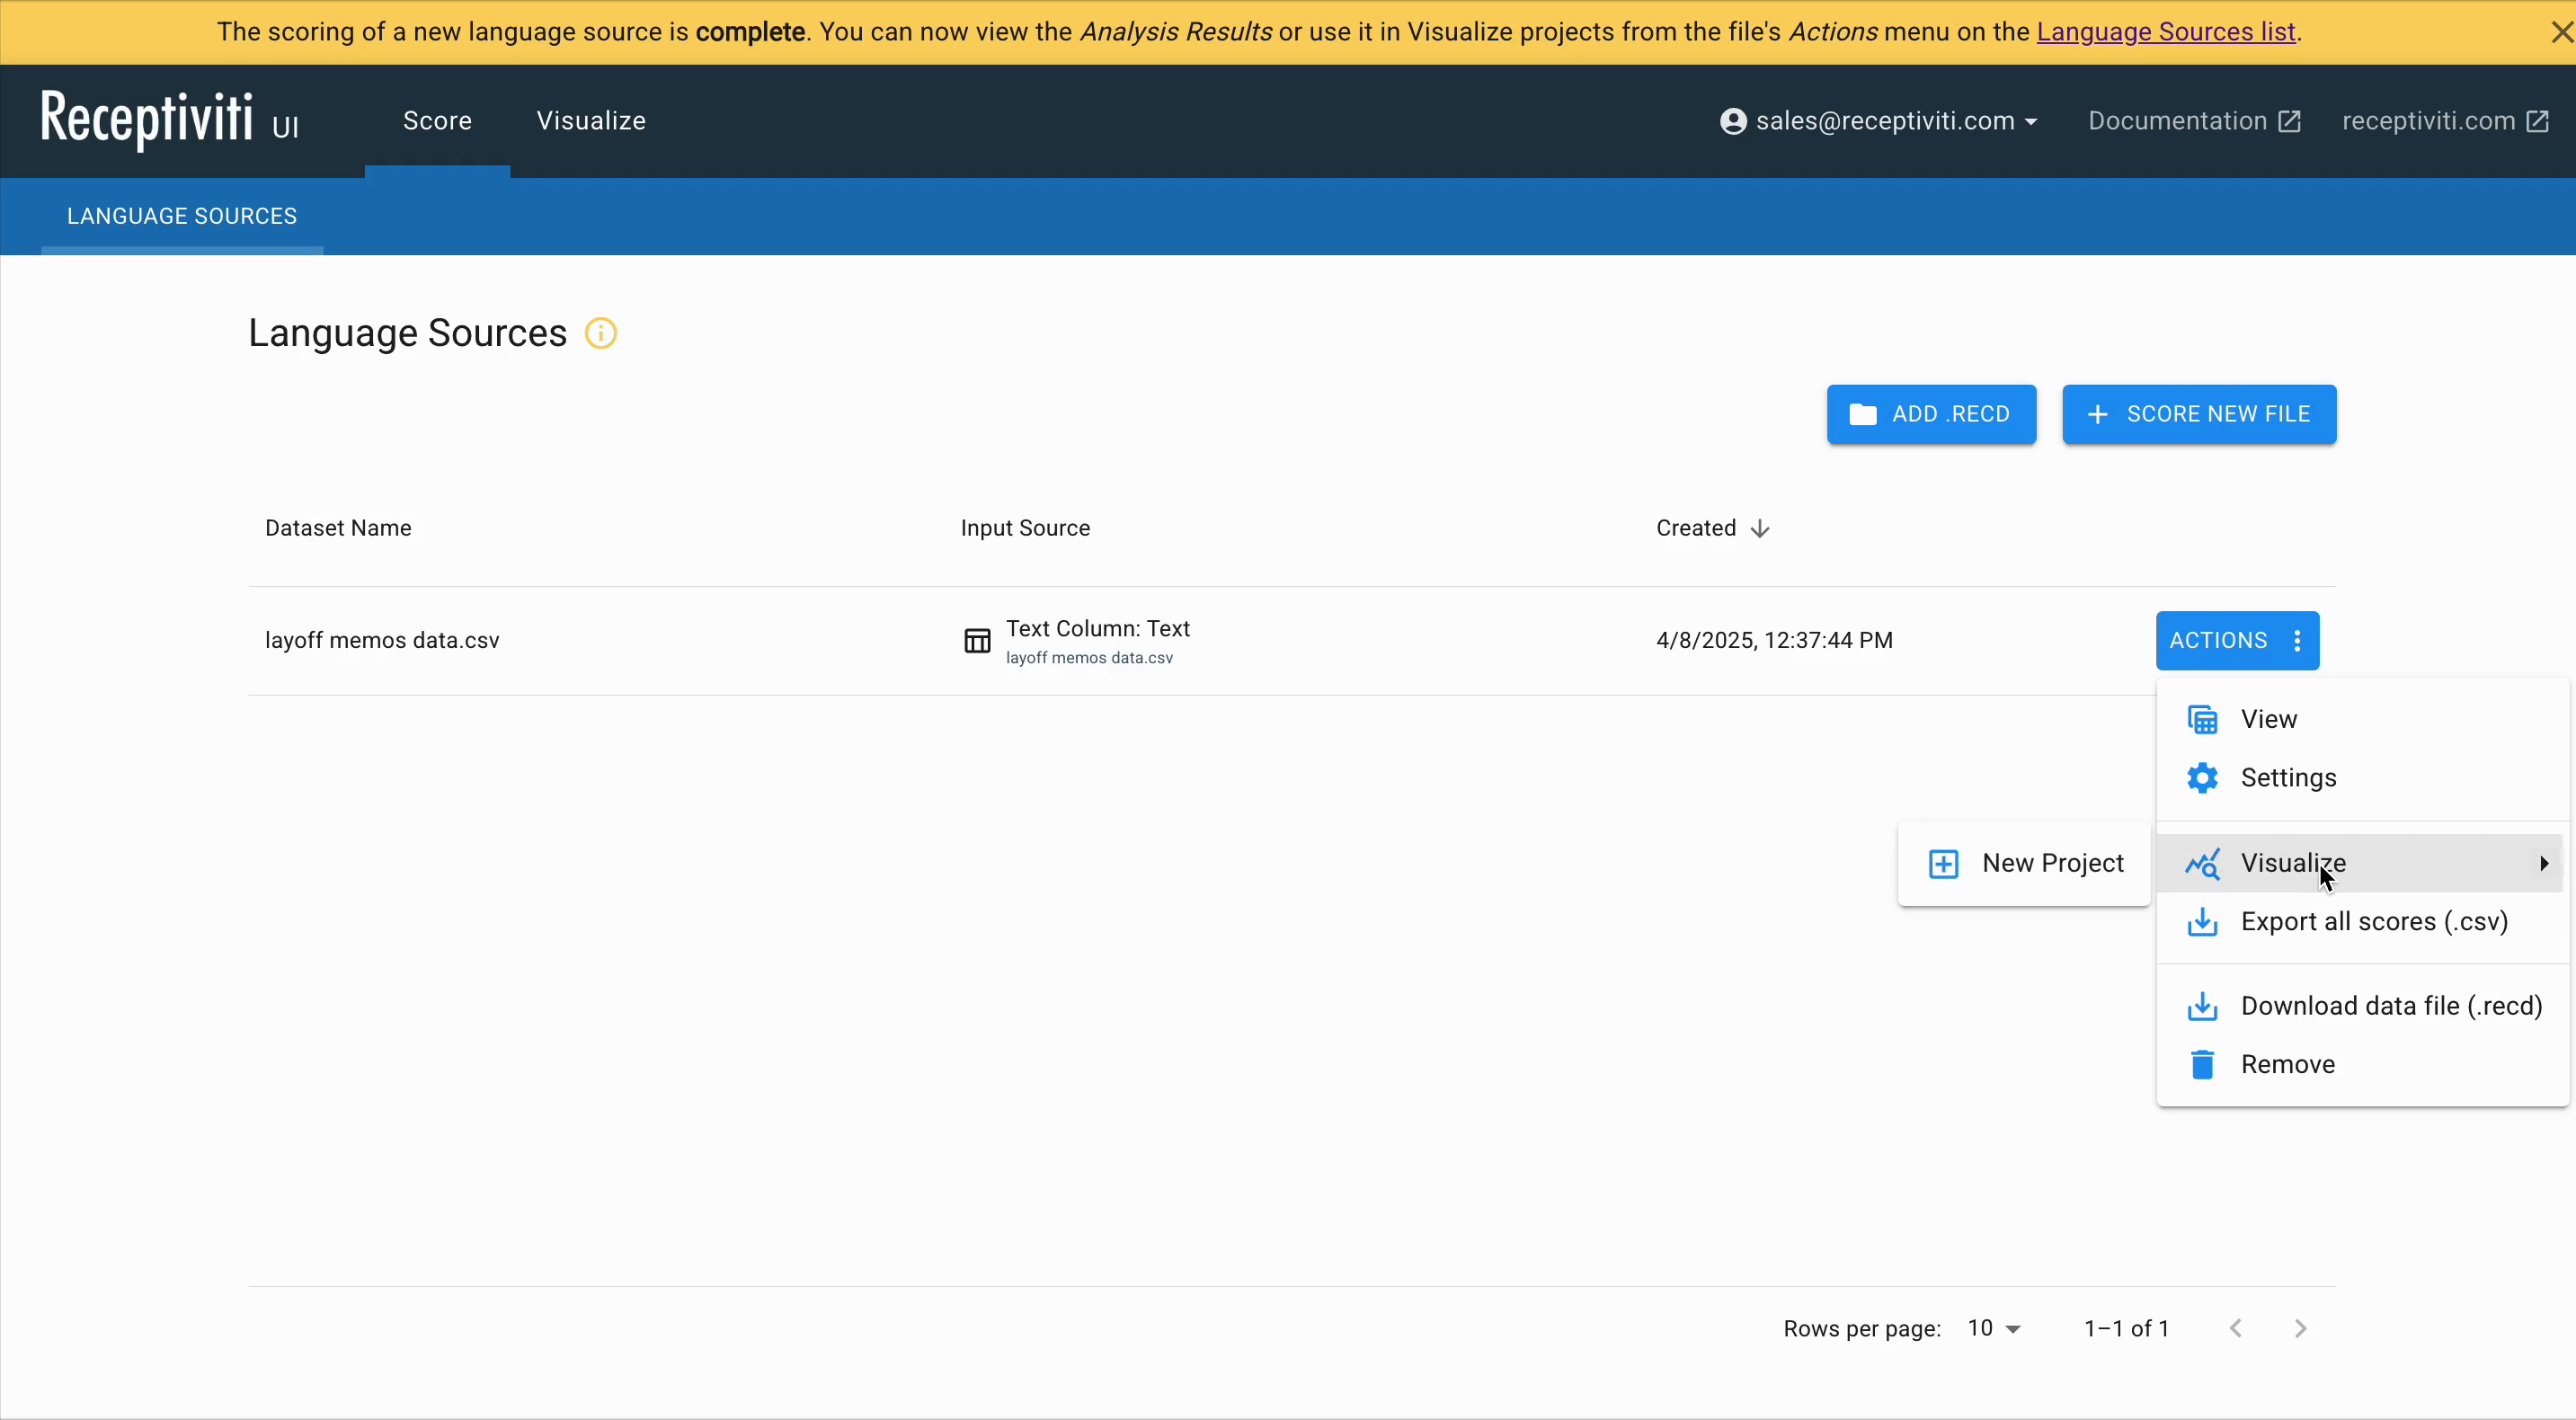
Visualizing a Language Dataset
Once your data source is analyzed and is complete, click the Actions button and select Visualize → New Project from the menu.
You will be taken to the Visualize tab, where various settings will appear based on the dataset you uploaded and scored.
Clicking the Visualize tab in the top navigation bar before any project has been saved opens the visualization menu, where you can begin creating a new project. If a project already exists, settings relevant to visualizing that dataset will be available.
Template Selection
At this stage, you have two options for setting up your project:
- Apply a template to automatically pre-fill recommended settings based on common use cases. This is a good choice if you're working with standard data types or want to get started quickly.
- Continue without a template to manually configure each setting. This gives you full control and is ideal for custom datasets or more advanced use cases.
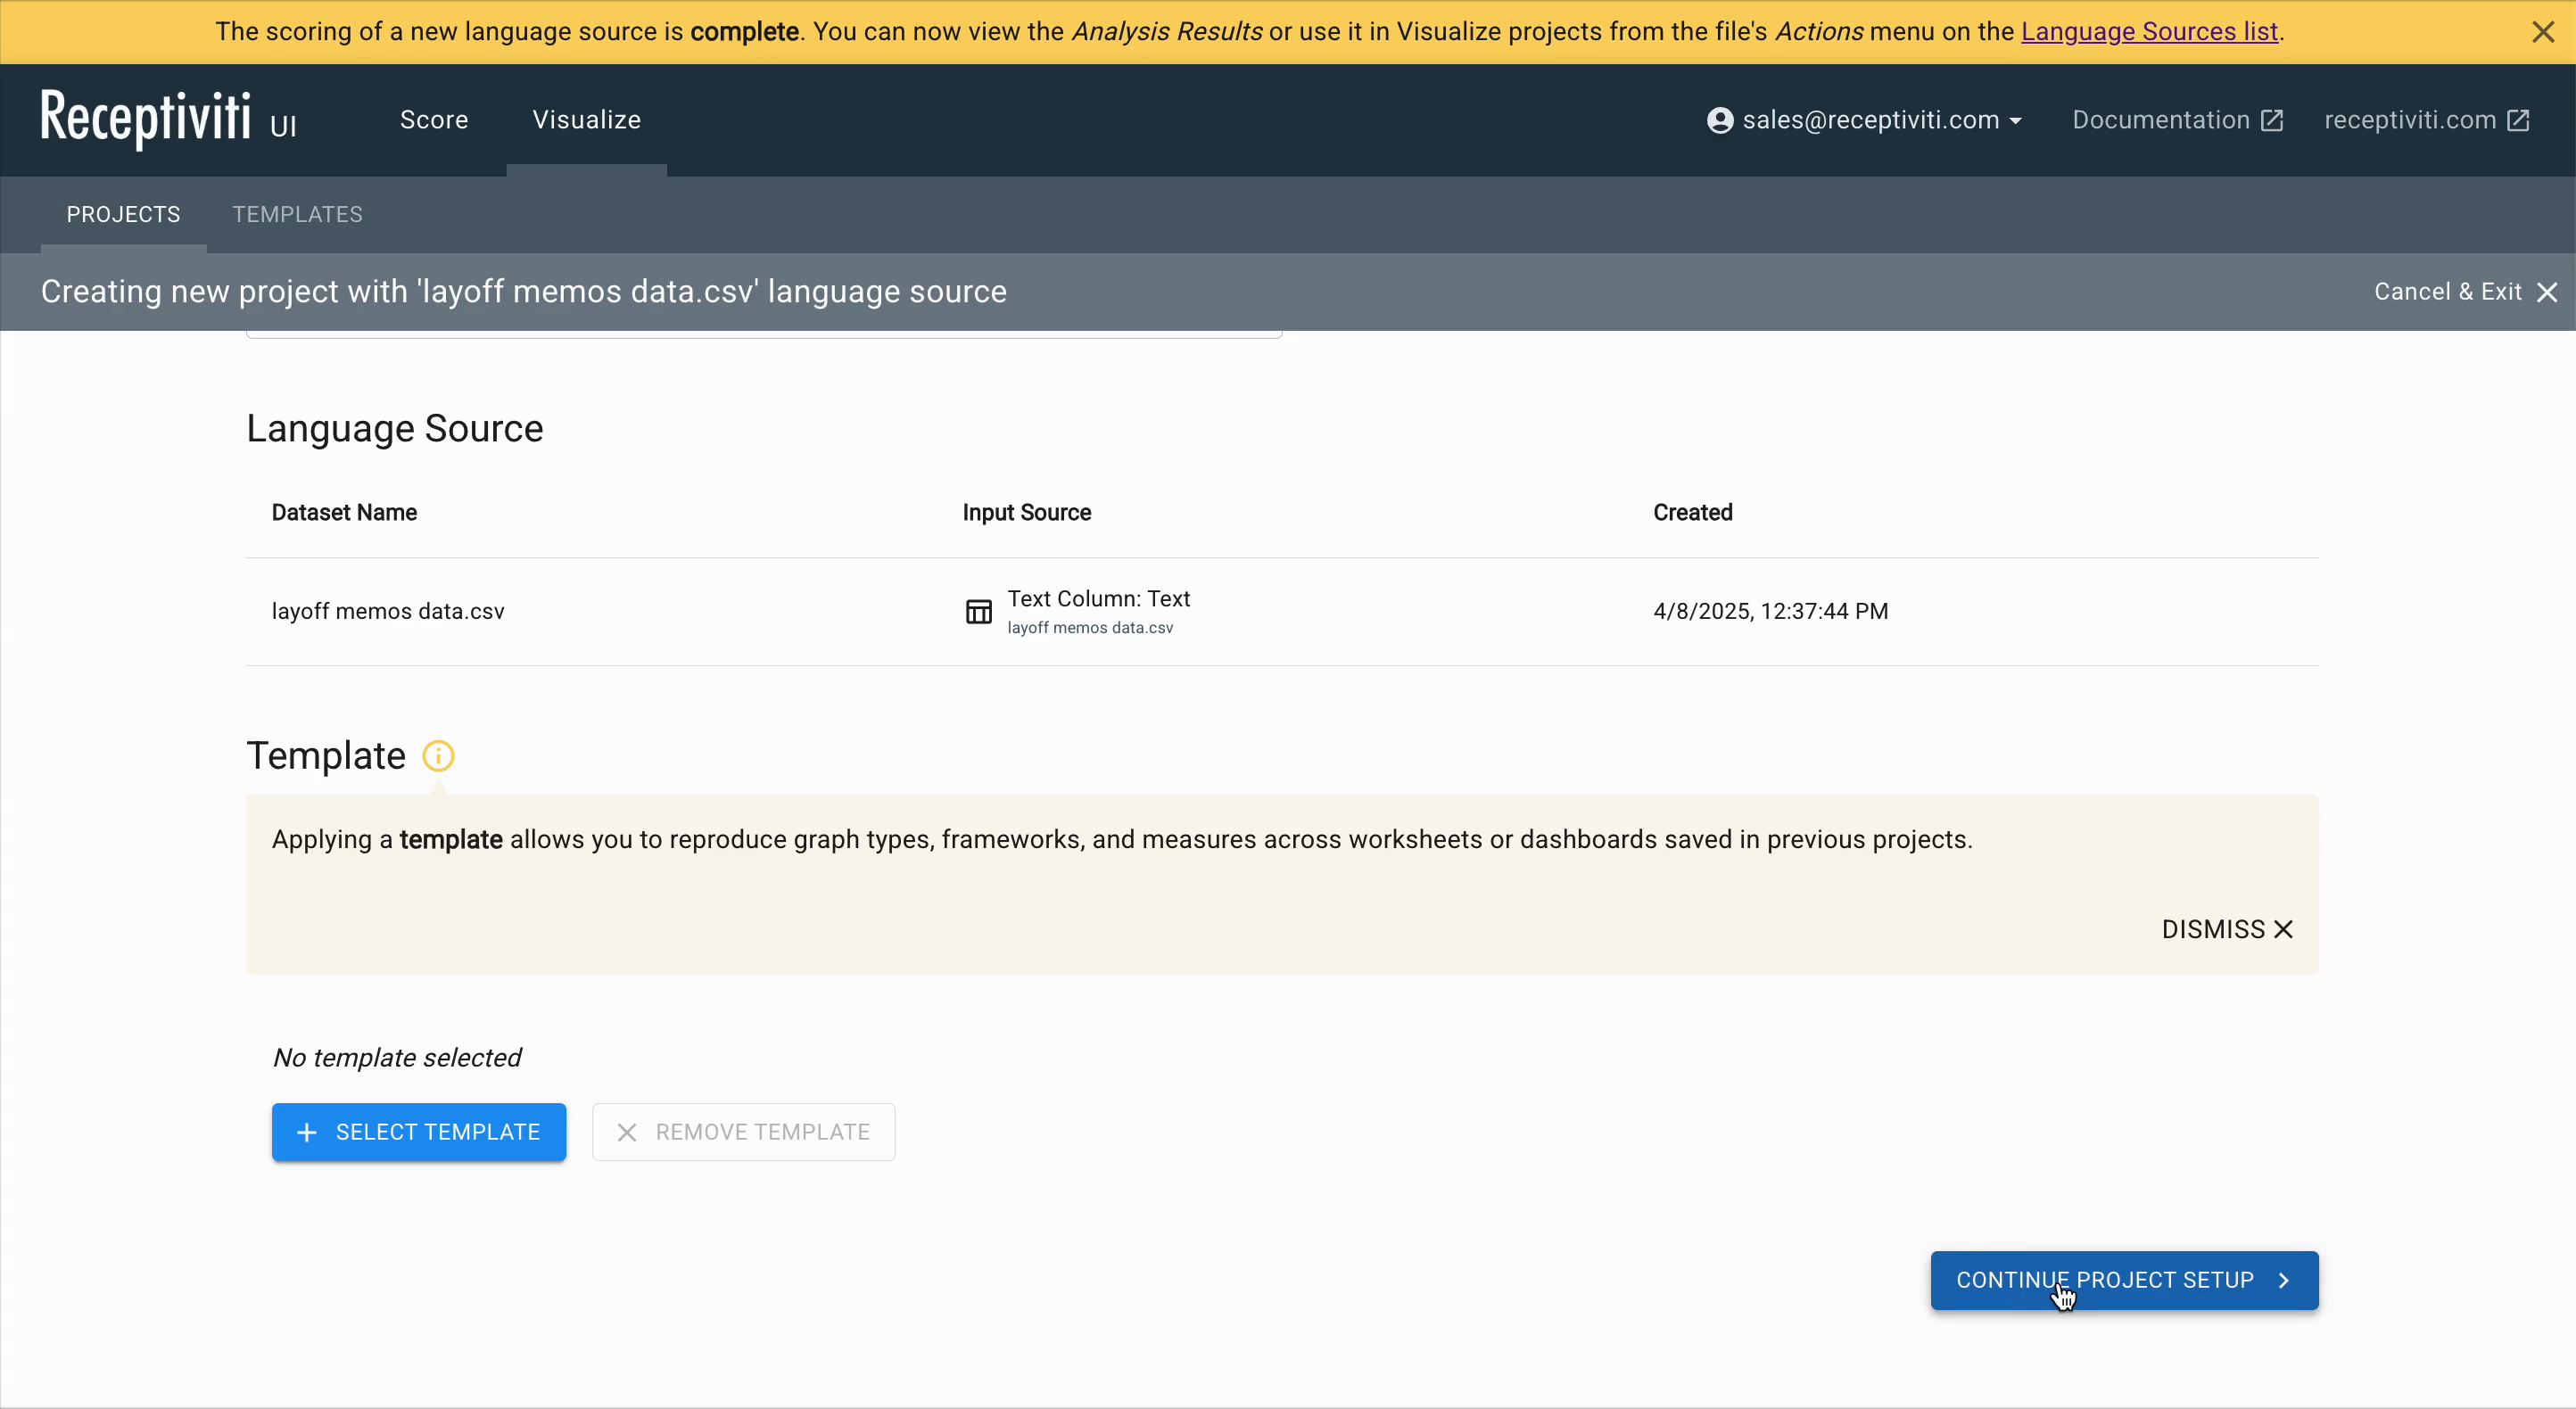
Click Continue Project Setup to move on to pre-visualization dataset settings.
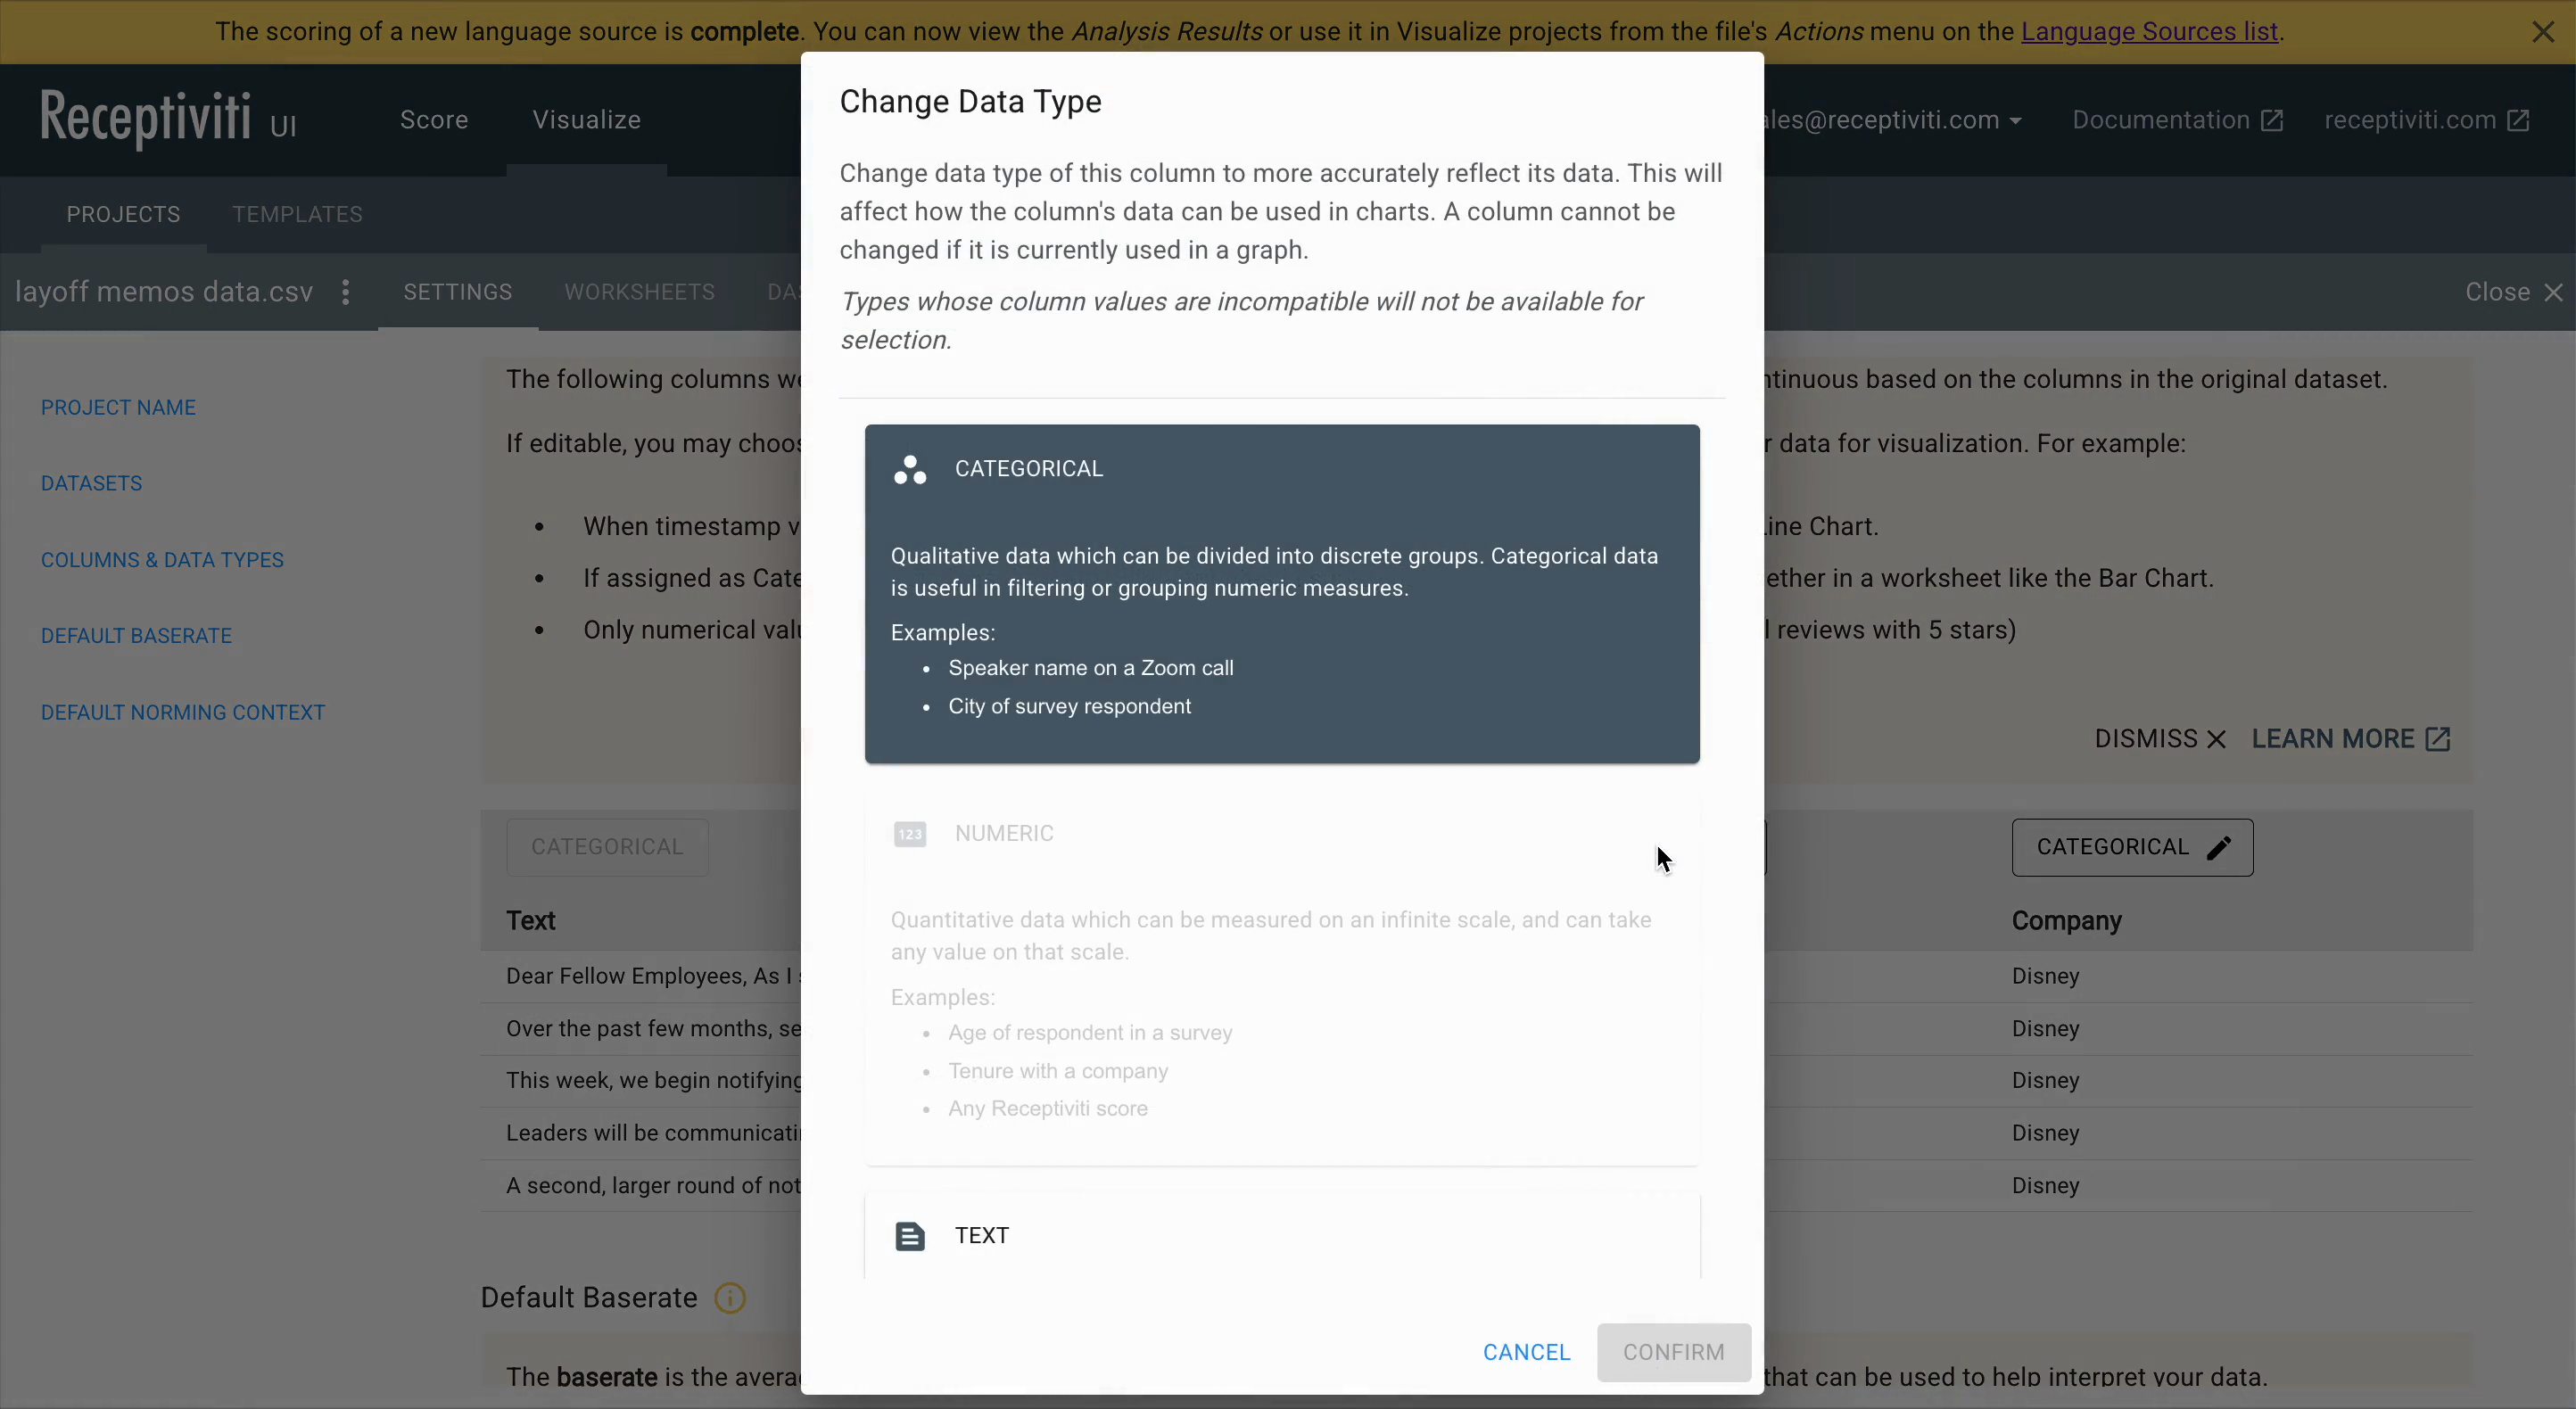
Column and Data Type Editing
At this stage, you can edit the column types in your dataset.
For example, if Text was selected, it will be treated as a Categorical type (which is what was scored).
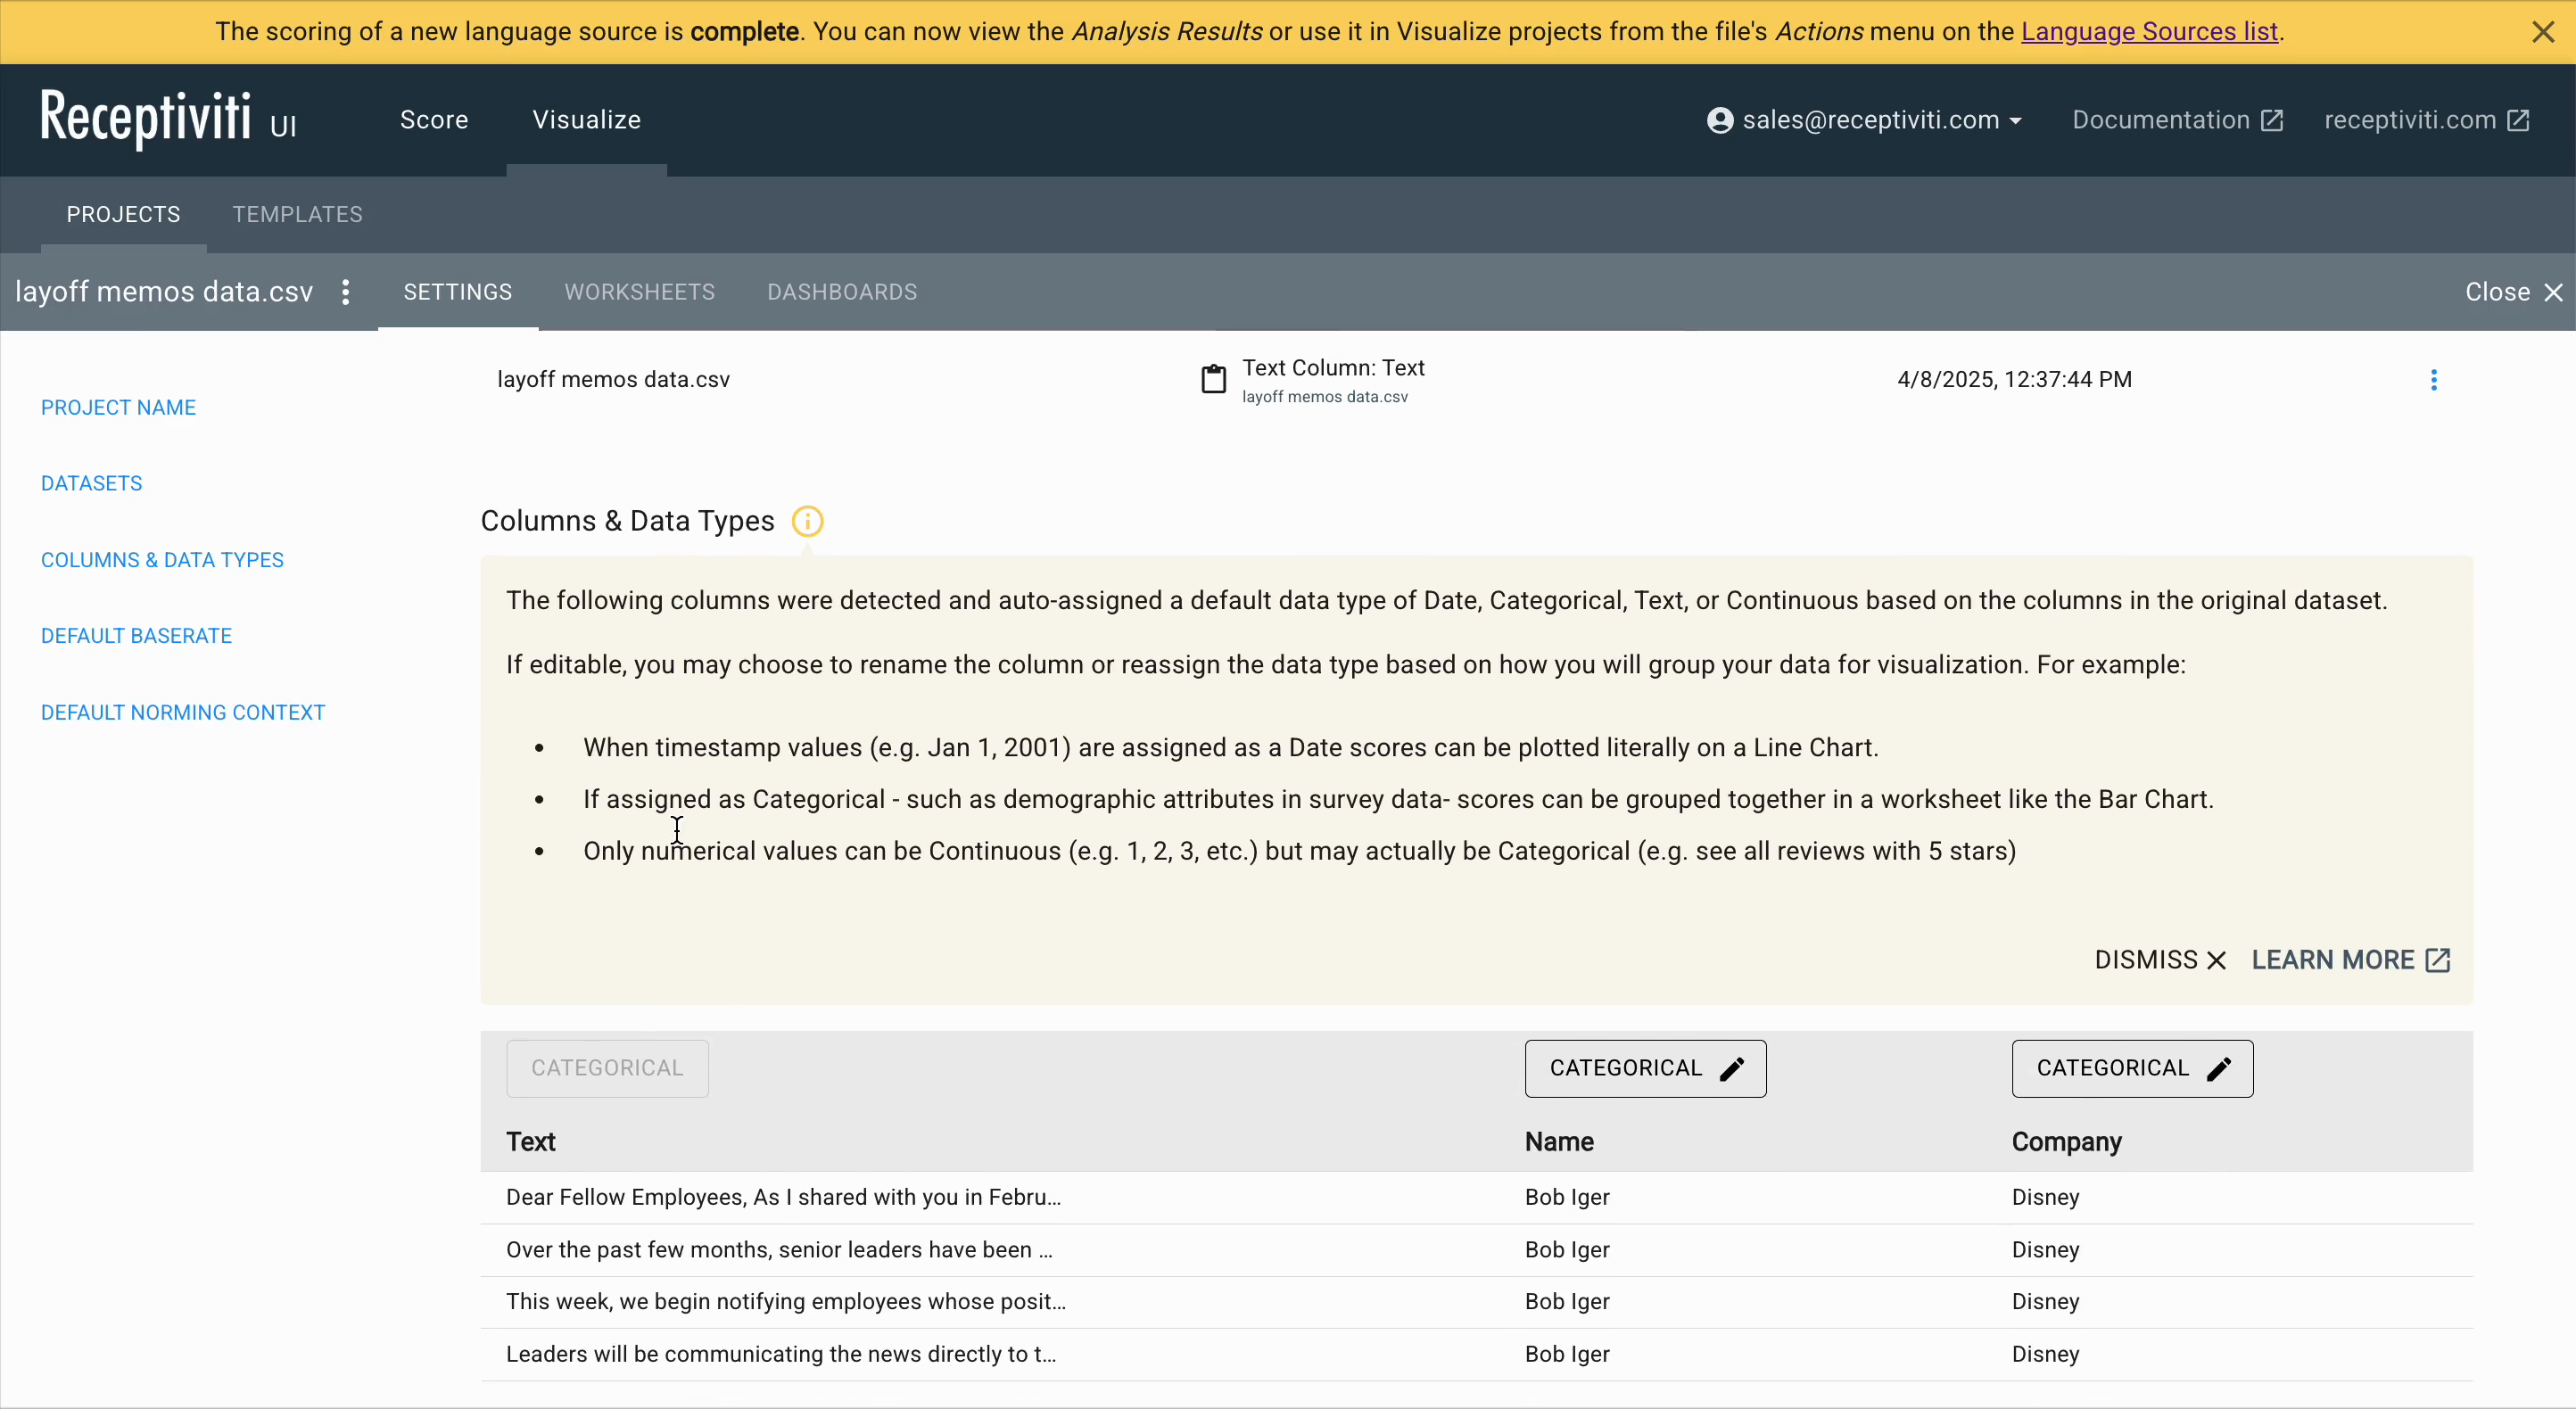
You can also modify the type of any other columns as needed. The options available are:
- Text – input language eligible for analysis
- Categorical – metadata for aggregation or filtering
- Numeric – numerical metadata
- Date – timestamps or date-based metadata
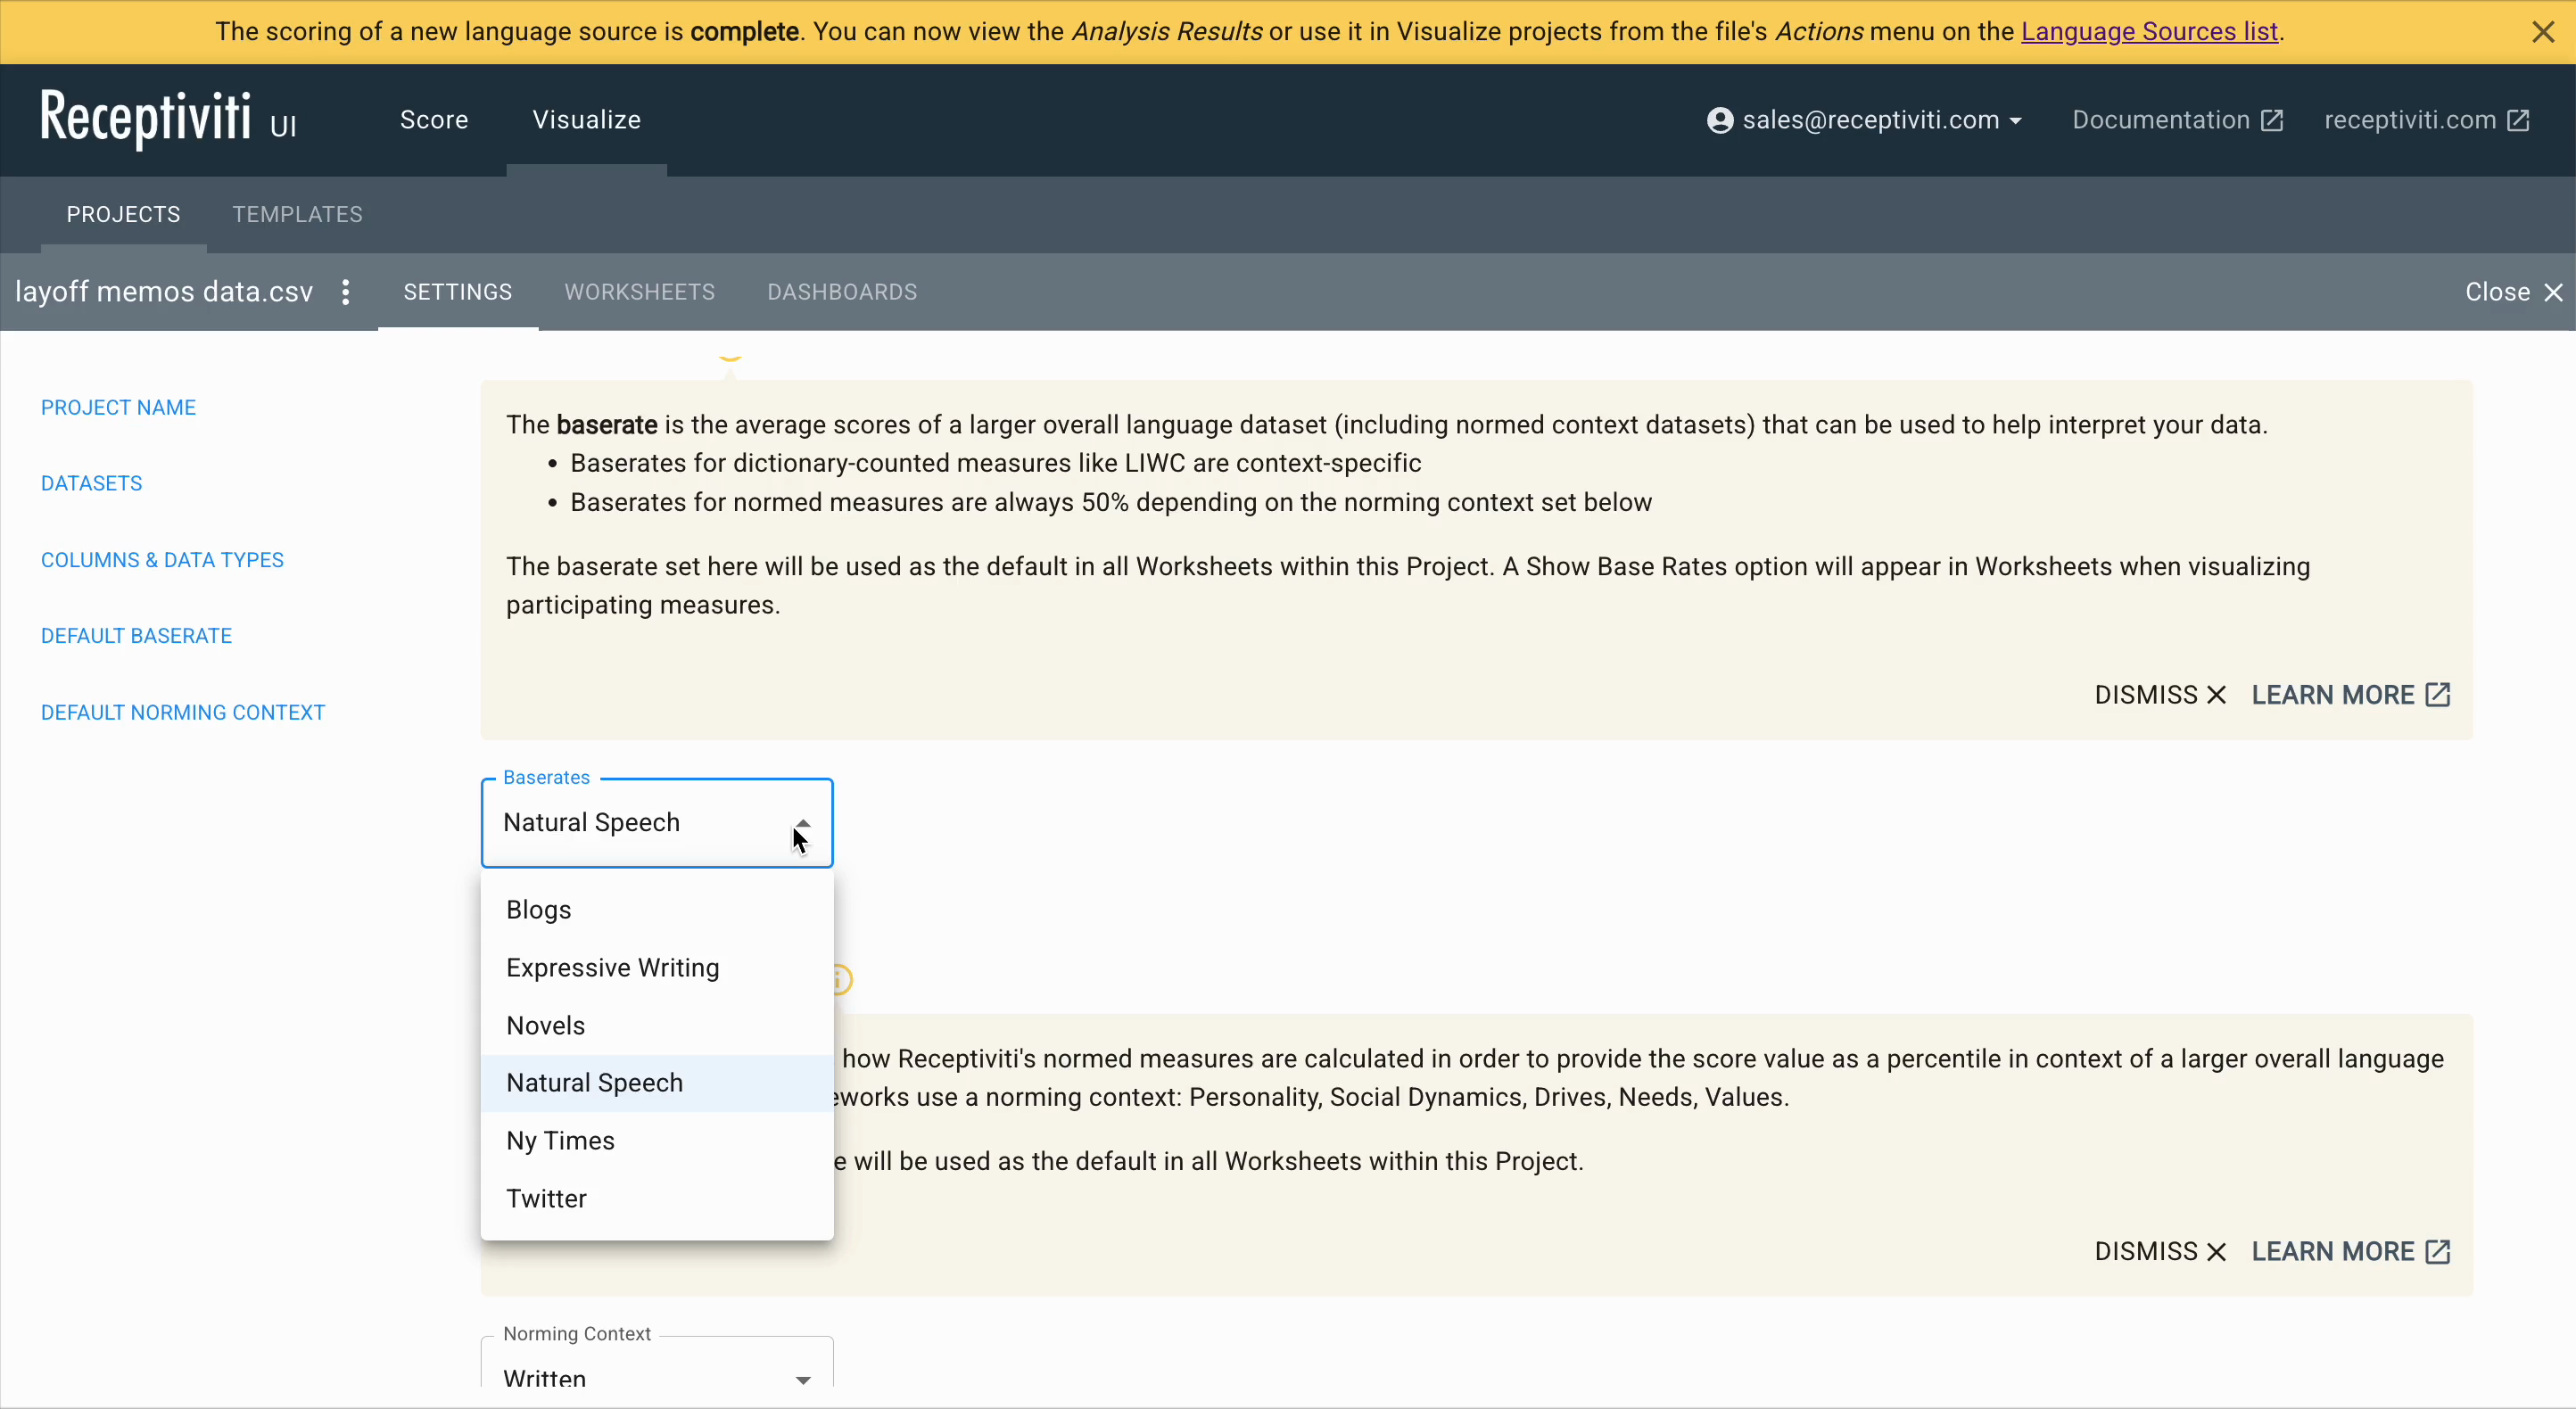
Base Rate Selection
Here, you can choose the default base rate.
Base rates represent average scores from a broader language dataset (including normed context sets) that help you interpret your own data.
The selected base rate will be used as the default for all worksheets within this project.
If available, a Show Base Rates toggle will appear in each worksheet when visualizing participating measures.
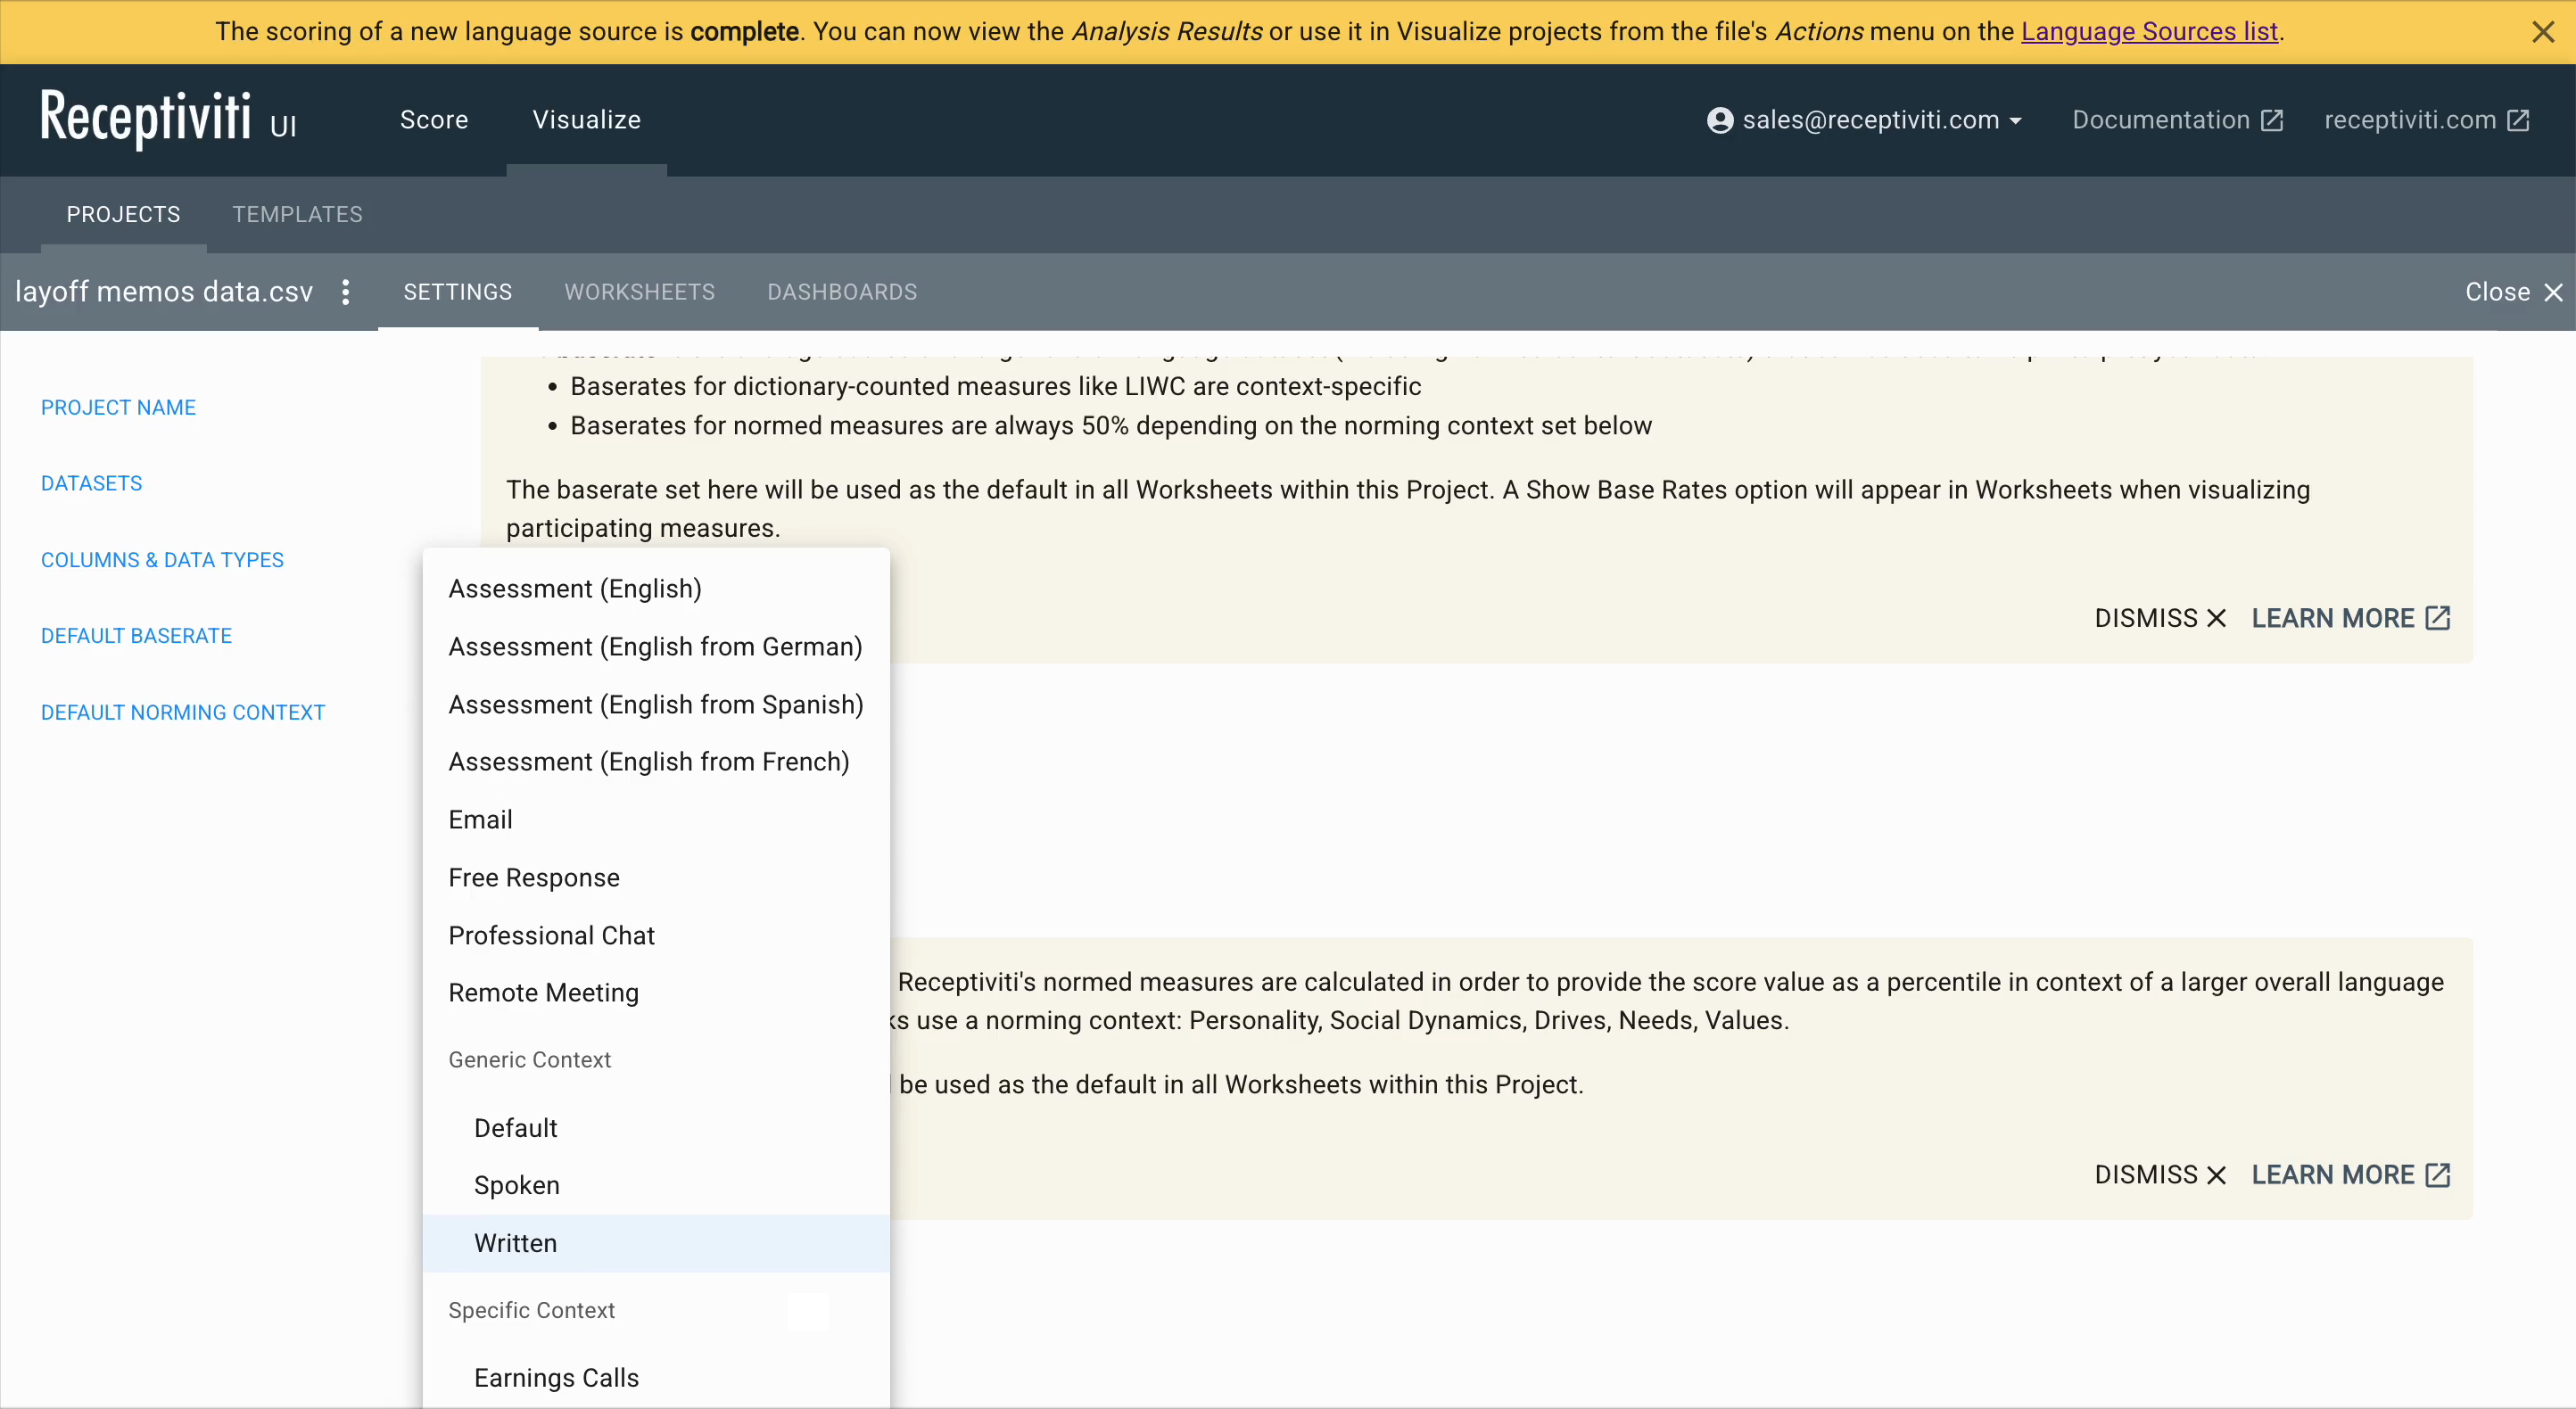
Norming Context Selection
You can also select a default norming context, such as Written, Spoken, Default, or any custom norm to align interpretation with the type of language in your dataset.
If your language dataset contains written memos, emails, etc., choose the written context; for spoken transcripts, choose spoken. These contexts affect how normed scores like Personality, Social Dynamics, Drives, Needs, and Values are interpreted.
Continue to Worksheets or Dashboards
Once settings are configured, you can proceed to explore your data using Worksheets or by creating Dashboards.
File Types
The Receptiviti UI saves data and project files separately. Data is downloaded as a .recd file and a project is downloaded as a .recp file. Template files are saved as .rect.
When you open a saved project and its associated data cannot be found in the browser cache, you will be prompted to upload the associated data file. In this case, you can upload the corresponding .recd file to restore the project.
Using these files can help you avoid using further word count on your plan by reloading the data that the UI has already analyzed, such as if you were to move to a different project file and then come back to the previously loaded one.
Opening an Existing Receptiviti UI Project
Opening an existing UI project requires that you have a .recp file (UI project file) saved to your system.
To open an existing file:
- Click Open Project from the UI home page.
- Select a
.recpfile from your system's hard drive to upload. - If your browser has not cached the corresponding
.recddata file for your project, you will be prompted to retrieve it from your system.
Once you have uploaded one or both of these files, you will be able to access the project and start building out visualizations.