Template Gallery
During project creation, the step that follows the selection of your language column to analyze is the the template selection process. The template gallery allows you to browse through the Receptiviti custom templates and any user-created custom templates.
Template options vary based on project type. The template offered in the template gallery step during project submission for one project type is not the same template as a different project template despite them sharing the same input type requirement.
Receptiviti Templates
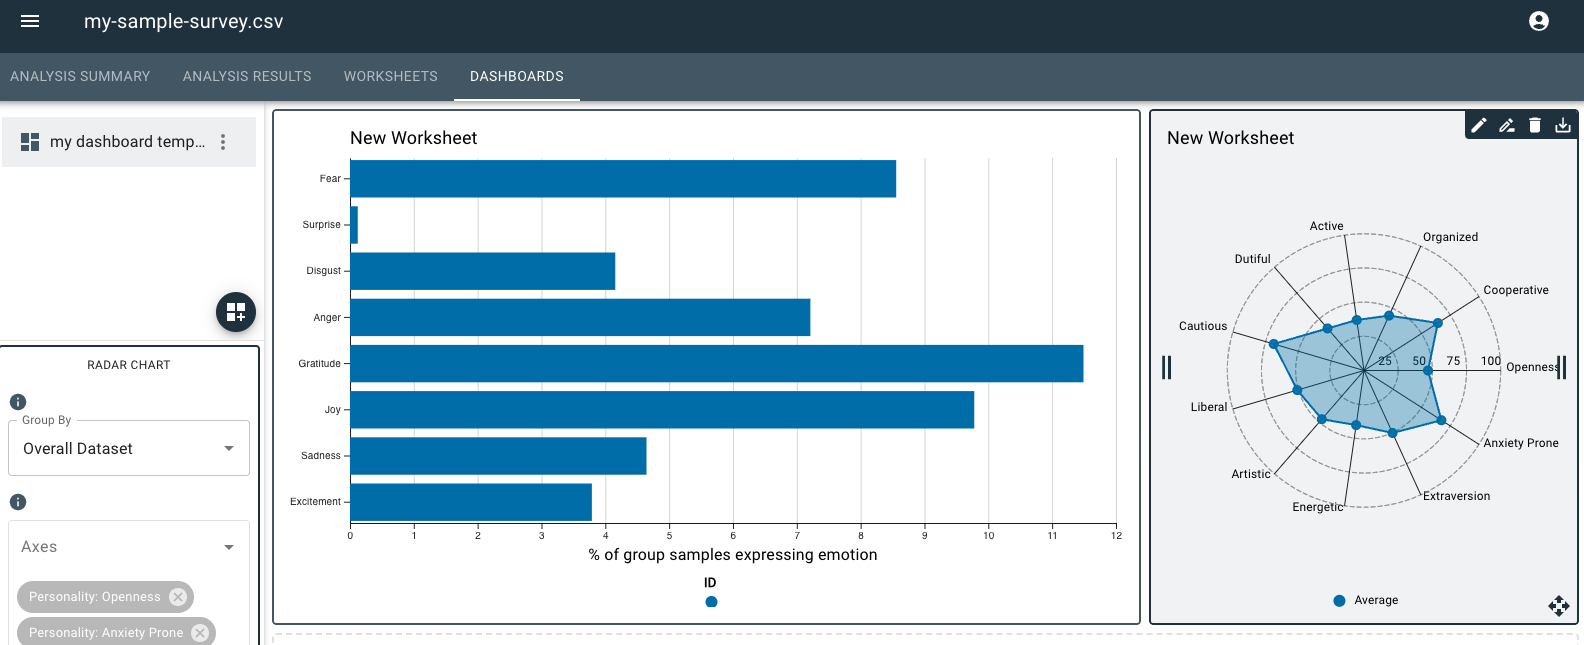
We have designed a suite of templates that are useful for common project types. These will allow you to view a customized set of worksheets and/or dashboards without having to build them yourself. The template gallery lists the templates as individual worksheets, as well as having them arranged together in dashboard form.
To apply a Receptiviti template:
- Go through the steps to create a project.
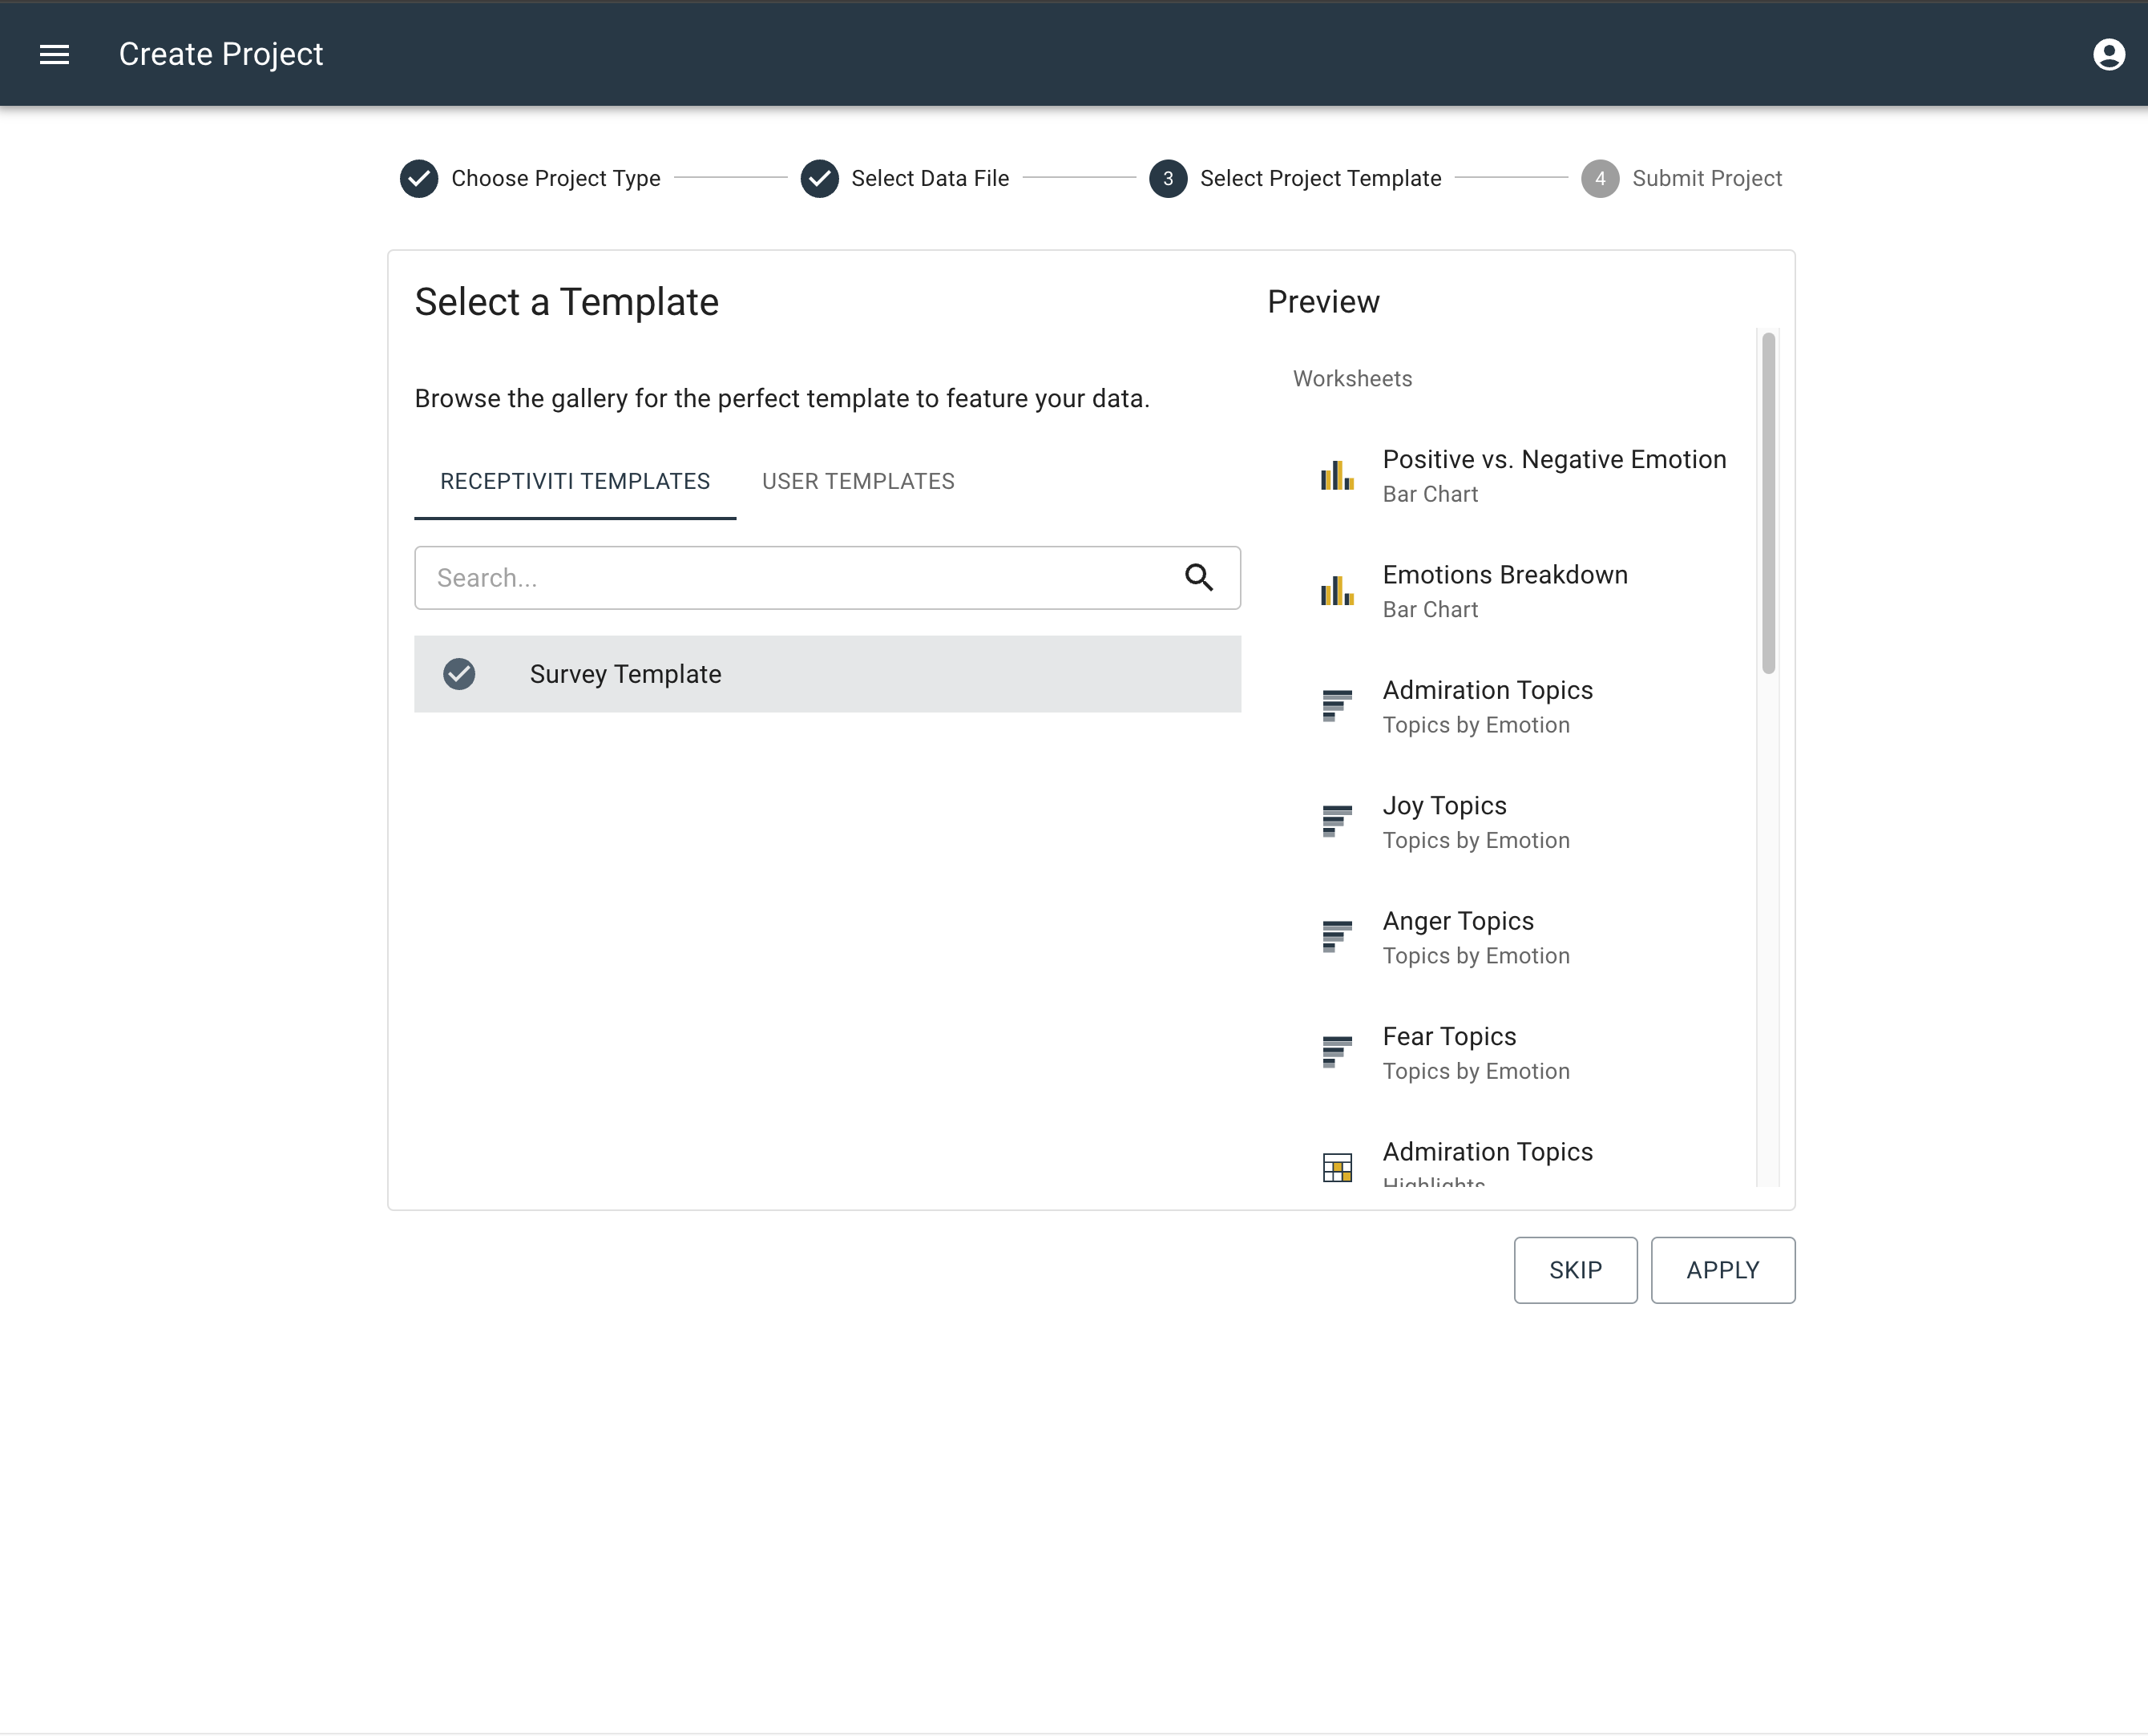
- When you reach the Select Project Template step, select the Receptiviti Templates tab.
- Under the search box you will see Survey Template (in the case of survey data). Select it.
- The Preview panel will appear on the right, in which you can scroll to browse the worksheets and dashboards included in the template.
- Click Apply.
See the video below for a walk-through of saving a template:
Default Survey Template
This template is a set of worksheets and a dashboard designed for survey insights. The Template Gallery provides a preview of the available templates. The worksheets included are as follows:
Worksheets in Default Survey Template
- Positive vs. Negative Emotion: Bar Chart
- Emotions Breakdown: Bar Chart
- Admiration Topics: Topics by Emotion
- Joy Topics: Topics by Emotion
- Anger Topics: Topics by Emotion
- Fear Topics: Topics by Emotion
- Admiration Topics: Highlights
- Joy Topics: Highlights
- Anger Topics: Highlights
- Fear Topics: Highlights
- Drives Expressed by Respondents: Radar Chart
- Schwartz Values Expressed by Respondents: Radar Chart
- Psychological States Expressed by Respondents: Radar Chart
Dashboards in Default Survey Template
Worksheets in Organizational Culture Dashboard
- Drives Expressed by Respondents: Radar Chart
- Schwartz Values Expressed by Respondents: Radar Chart
- Psychological States Expressed by Respondents: Radar Chart
Default Transcript Template
This template is a set of worksheets and a dashboard designed for transcript insights. The Template Gallery provides a preview of the available templates. The worksheets included are as follows:
Worksheets in Default Transcript Template
- Emotions Breakdown: Bar Chart
- Word Count By Speaker: Bar Chart
- Analytical Thinking Over Time By Speaker: Line Chart
- Cognitive Load Over Time By Speaker: Line Chart
- Authenticity Over Time By Speaker: Line Chart
- Clout Over Time By Speaker: Line Chart
- Language Style Matching (LSM): Heatmap
- Group Drives: Radar Chart
- Group Schwartz Values: Radar Chart
- Drives By Speaker: Radar Chart
- Shwartz Values by Speaker: Radar Chart
- "I" Words Over Time By Speaker: Line Chart
- "We" Words Over Time By Speaker: Line Chart
- Certainty Over Time By Speaker: Line Chart
- Tentative Over Time By Speaker: Line Chart
- Positive Emotion Over Time By Speaker: Line Chart
- Negative Emotion Over Time By Speaker: Line Chart
- Group Time Orientation By Speaker: Bar Chart
- Future Focus Over Time By Speaker: Line Chart
- Group Curiosity and Openness: Radar Chart
- Curiosity Over Time By Speaker: Line Chart
- Open To Change Words Over Time By Speaker: Line Chart
- Group DISC Profile: Radar Chart
- Group DISC Profile: Bar Chart
- DISC Profile By Speaker: Radar Chart
Dashboards in Default Transcript Template
Worksheets in Group Commitment Dashboard
- Language Style Matching (LSM): Heatmap
Worksheets in Group Drives and Values Dashboard
- Group Drives: Radar Chart
- Group Schwartz Values: Radar Chart
- Drives By Speaker: Radar Chart
- Shwartz Values by Speaker: Radar Chart
Worksheets in Group Collaboration Dashboard
- "I" Words Over Time By Speaker: Line Chart
- "We" Words Over Time By Speaker: Line Chart
- Certainty Over Time By Speaker: Line Chart
- Tentative Over Time By Speaker: Line Chart
- Positive Emotion Over Time By Speaker: Line Chart
- Negative Emotion Over Time By Speaker: Line Chart
- Group Time Orientation By Speaker: Bar Chart
- Future Focus Over Time By Speaker: Line Chart
Worksheets in Group Curiosity and Openness Dashboard
- Group Curiosity and Openness: Radar Chart
- Curiosity Over Time By Speaker: Line Chart
- Open To Change Words Over Time By Speaker: Line Chart
Worksheets in Group DISC Profile Dashboard
- Group DISC Profile: Radar Chart
- Group DISC Profile: Bar Chart
- DISC Profile By Speaker: Radar Chart
Default General Data Table Transcript
This template contains a Summary bar chart containing several prominent LIWC measures: Analytical Thinking, Clout, Authentic, and Emotional Tone. These measures provide an overall glimpse into the personalities of the people in question and compare them to each other side-by-side.
This template is a work in progress.
User Templates
When you create a worksheet or a dashboard, you will likely find that you want to use the same graph types and frameworks and measures to apply to other datasets or parts of your dataset. By using the User Templates feature, you can upload templates that you have already saved.
If you save a template, it will save the current state of the project's worksheets and dashboards. Templates are not individual worksheets or dashboards to load into an existing project; they are projects themselves.
To create and save your own custom user template:
-
Create one or more worksheets and/or dashboards of your liking that represent your data in a way that you wish to save as a template.
-
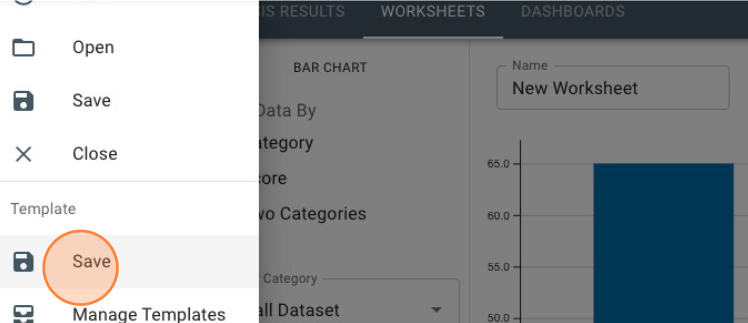
At the top left of the page, click the menu icon.
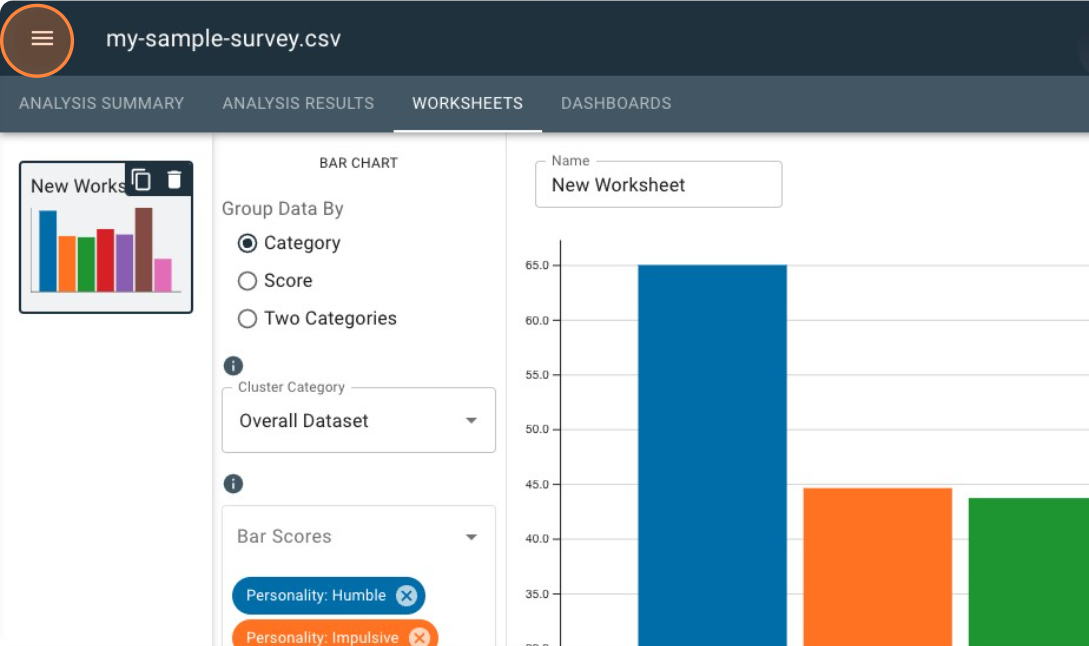 ;
; -
Click Save under the Template heading.
 ;
; -
Give your template a name in the File Name field, then click Save File. (You can also choose to stick with the default template name, which is the name of the project.)
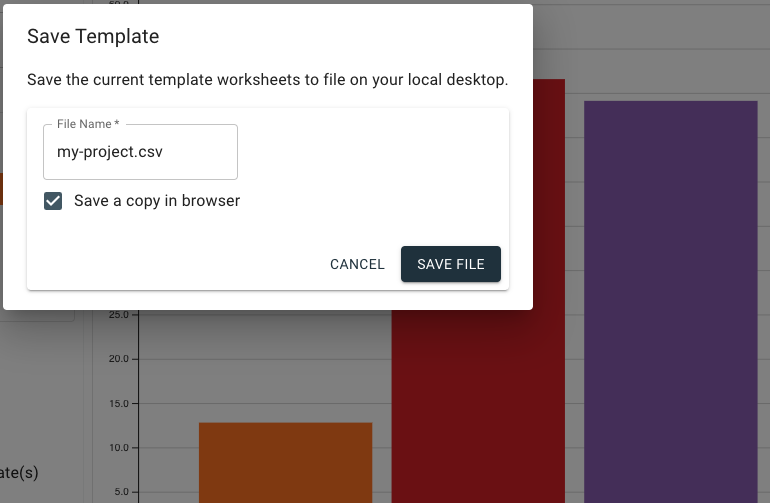
This will save a
.recttemplate file to your computer, and if you choose to keepSave a copy in browserchecked, will also save the file to the UI. When retrieving the.recttemplate file from your computer to view with your dataset, you will have to create a new project and locate it within your file finder.infoYou cannot apply a user template to a currently open project — the Manage Templates menu acts as a reference for existing user templates when viewing it while within an open project. To open a template, you must either start a new project or load an existing template.
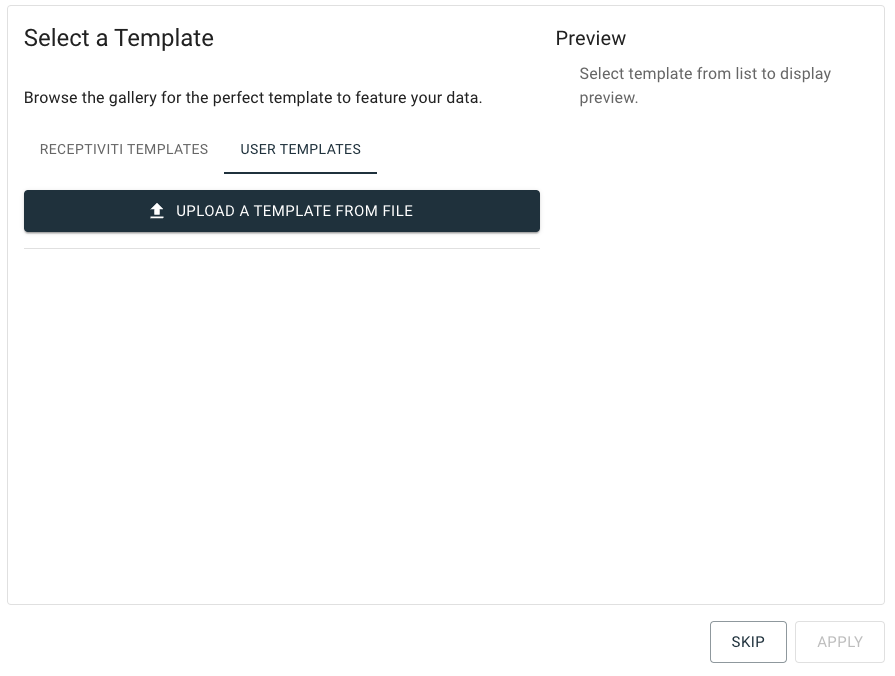
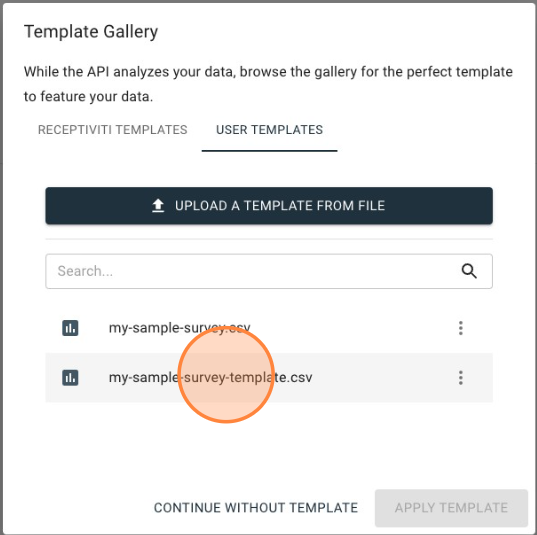
To load a user template (.rect template file) into a project if it is saved to the UI:
-
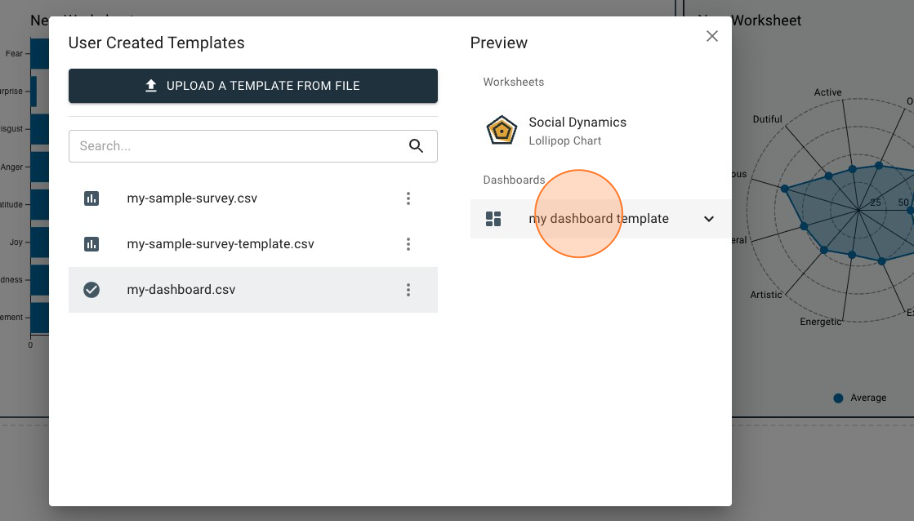
In the Template Gallery, with the User Templates tab selected, click a template you would like to load.
-
Click Apply.

-
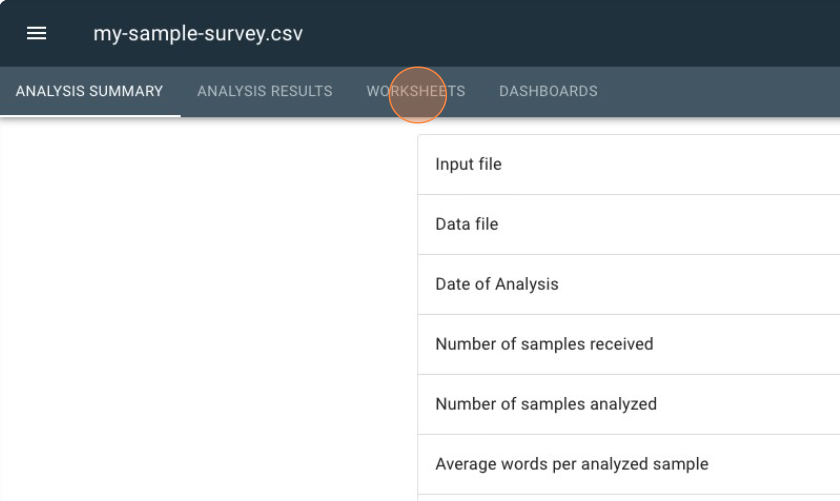
If the template contains worksheets, click the Worksheets tab. If it contains dashboards, click the Dashboards tab.
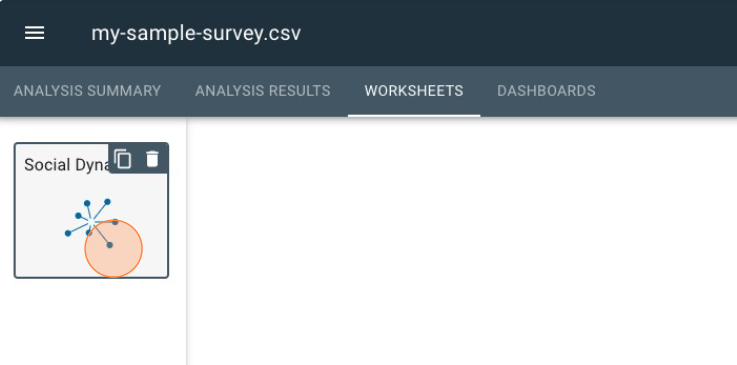
-
For worksheets: When you load a template, you can preview the worksheet(s) it contains on the left side of the interface. To view or edit a worksheet, click on it.
-
For dashboards: the template will load and you will see the dashboard template listed in the preview window at the left of the interface. To view or edit a worksheet, click on it.
-
To view a user template (.rect template file) from within the UI:
-
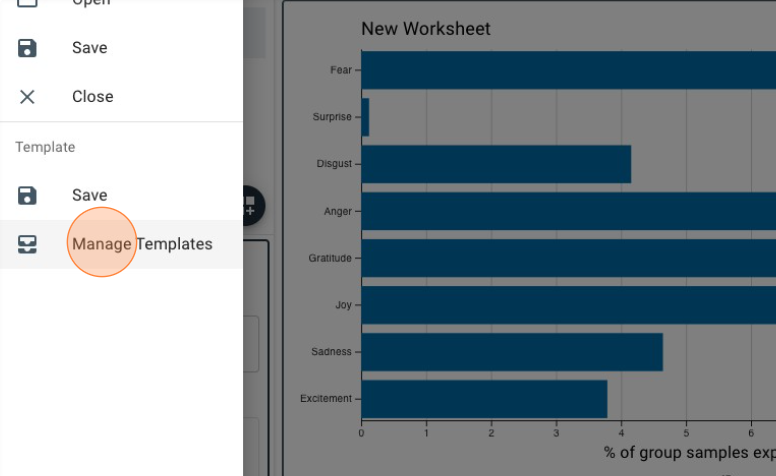
At the top left of the page, click the menu icon.
; -
Click Manage Templates.
-
Click any template listed to view details about it. You can use the editing icon to delete and rename the template(s).
See the video below for a walk-through of editing, renaming, and deleting templates:
Column Matching
You may need to match columns of your dataset in cases where the default column naming convention within the template does not correspond verbatim to a column in your dataset. In the case of the image below, the dataset contains a column called Speaker that you must match to the speaker_name column, which is the naming convention within the chosen template.
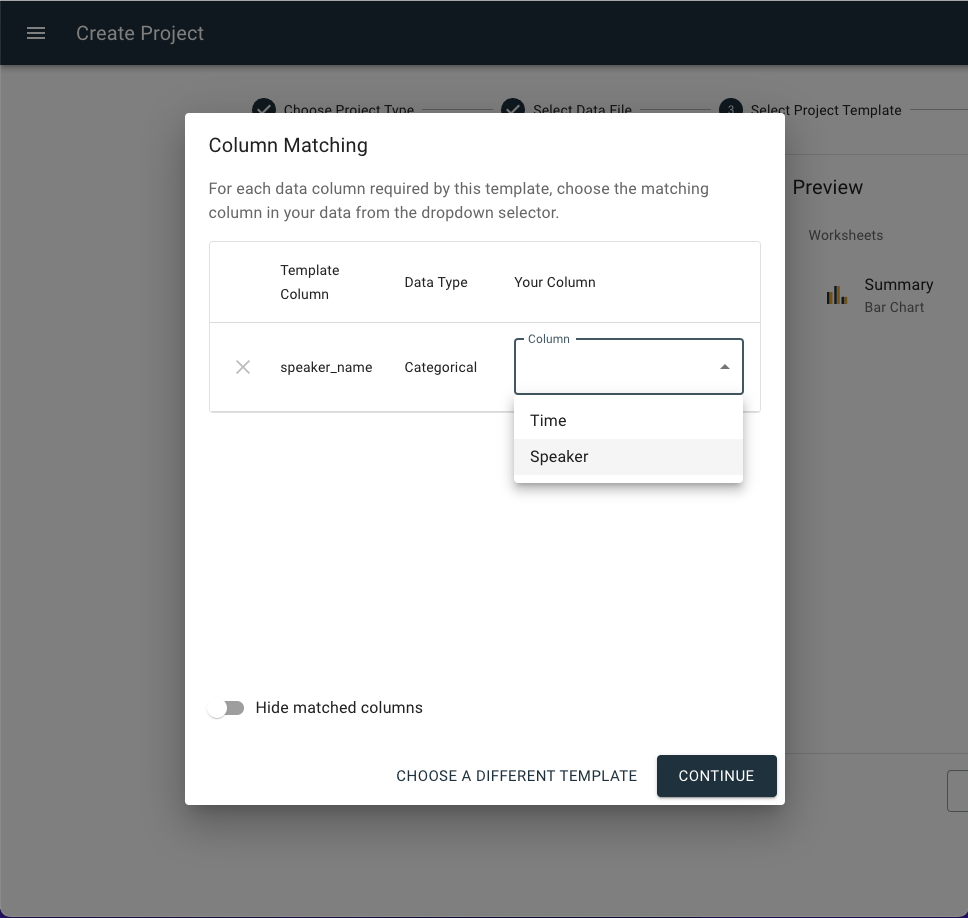
Partial Column Matching: When you don't match all columns during the setup, you can still proceed to the analysis phase. However, please be aware that some dimensions will be missing, which may affect the functionality of certain charts. This can be useful for preliminary reviews, but for a comprehensive analysis, ensure all required columns are matched.
The Hide matched columns toggle button displays only the columns from your CSV file that do not match a column found within the template columns.